CashGuardian™
CashGuardian™ sifts through data so you can focus on what matters
Built into every version of CashFlowTool.
See a demo
Wouldn't it be nice if you knew ahead of time . . .
If there were any unexpected bills If you had any past due customer invoices What vendor bills were overdue If you had a future cash shortage Your forecasted cash-in & cash-out
With CashGuardian, you now can!
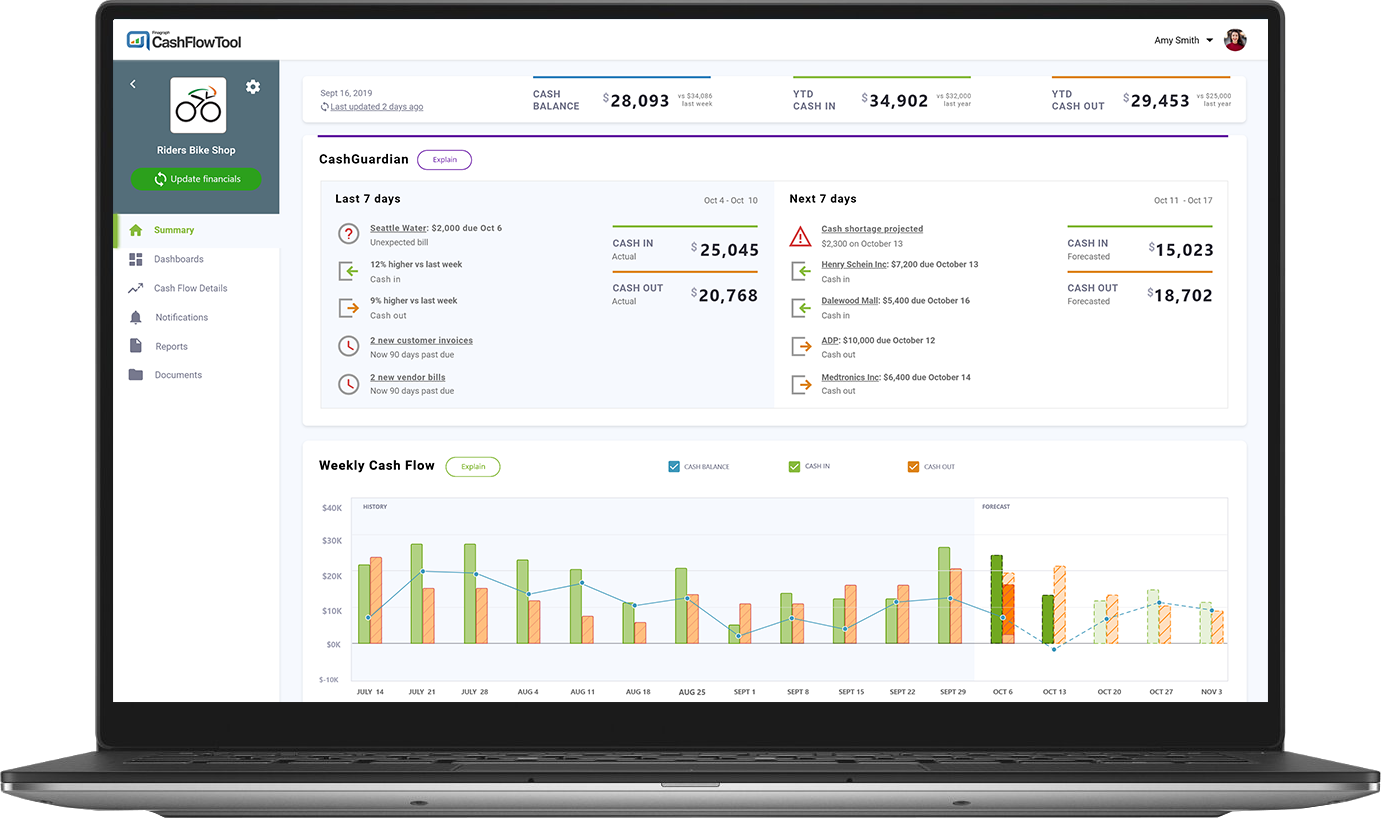
The CashGuardian™ service, built into every version of CashFlowTool, watches out for anything out of the norm and alerts you. It sifts through all the data and surfaces the most important things so you are aware and can either take action or be assured that things are running smoothly. CashFlowTool automatically synchronizes the data with QuickBooks on a weekly basis and so you will always see what happened the last 7 days and the next 7 days ahead.
CashGuardian™ is an integrated part of the CashFlowTool Summary screen.
Learn more
Get CashFlowTool now to see CashGuardian™ in action
Sign up today and take control of your cash flow.
CashGuardian™ lets you see what happened
during the last 7 days and the next 7 days
Last 7 days
Cash In & Cash Out

Cash in and Cash out shows you all the cash that came into your business and all of the cash that went out of your business for the period. This is based on all the transactions that impacted your cash.

Unexpected bills

CashGuardian checks for unexpected bills by scanning through the last 12 months of transactions and looks for transaction amounts that are significantly greater than past payments made. If it finds any, it will show the top unexpected bill. The Unexpected Bills card on the dashboard will show the top 5 unexpected bills.


Cash in/out
versus last week

You can see how this number compares to the previous 7 days and determine if your cash out and cash in is increasing or decreasing since the previous week.
While we show you a quick stat at a glance, business owners will most likely already have an idea what the numbers should be.
If the cash in or out percent change number is higher or lower than you expected, then this is your opportunity to drill down and ask questions. By asking good questions, you will be able to grow your business and avoid surprises.
Keep in mind, an increase in expense may not be bad for your business. For example, last week you purchased more inventory for your business which will help generate more sales.
By glancing at the Cash Flow chart below CashGuardian, you can see how your expenses from the last 7 days, compares to previous weeks. If you see a steady rise in cash out, without a corresponding rise in cash in, then this means you need to dig in more.

Past due invoices

You work hard to perform a valuable service to your customers, and you expect to get paid in a timely fashion. Sometimes customers fall behind making payments. CashFlowTool automatically lets you know if you have new customers that cross the 90 days threshold. If the number of customers hitting this threshold each week increases, this may indicate a problem that needs further investigation. It is estimated the customers & vendors that are past 90 days old only have less than 75% chance of being paid so it’s important to stay on top of the invoices crossing this threshold.
Past due bills

The same is true for vendor bills that cross the 90-day threshold. Having bills greater than 90 days past due can negatively impact your business credit score, likelihood of receiving a line of credit and business reputation.
Next 7 days
Cash In & Cash Out

Cash-in shows you how much cash-in is forecasted in the next 7 days.
This includes transactions that CashFlowTool has forecasted to occur based on past transactions from the last 12 months and open invoices in QuickBooks.
Select the week on the Cash Flow chart to see the top 3 cash-in and cash-out transaction for the next week.

Cash Shortage

Cash shortage lets you know if cash on hand goes below 0 in the next 7 days. While your forecasted cash-in maybe less than forecasted cash-out, its still possible to dip below zero within the next 7 days.
Top 2 Cash-in transactions

Shows your top 2 cash-in transactions forecasted for the next 7 days. Select each week in the chart to see top 3 cash-in and cash-out transactions.
Top 2 Cash-out transactions

Shows your top 2 cash-out transactions forecasted for the next 7 days. Select each week in the chart to see top 3 cash-in and cash-out transactions.
For the first time, business owners truly have a cash flow management and forecasting service that lets them fully understand their cash flow situation. CashGuardian will save businesses hundreds of hours by doing the tedious work for them and surfacing the items that really matter.

James Walter
CEO
Finagraph