Common Financial Ratios
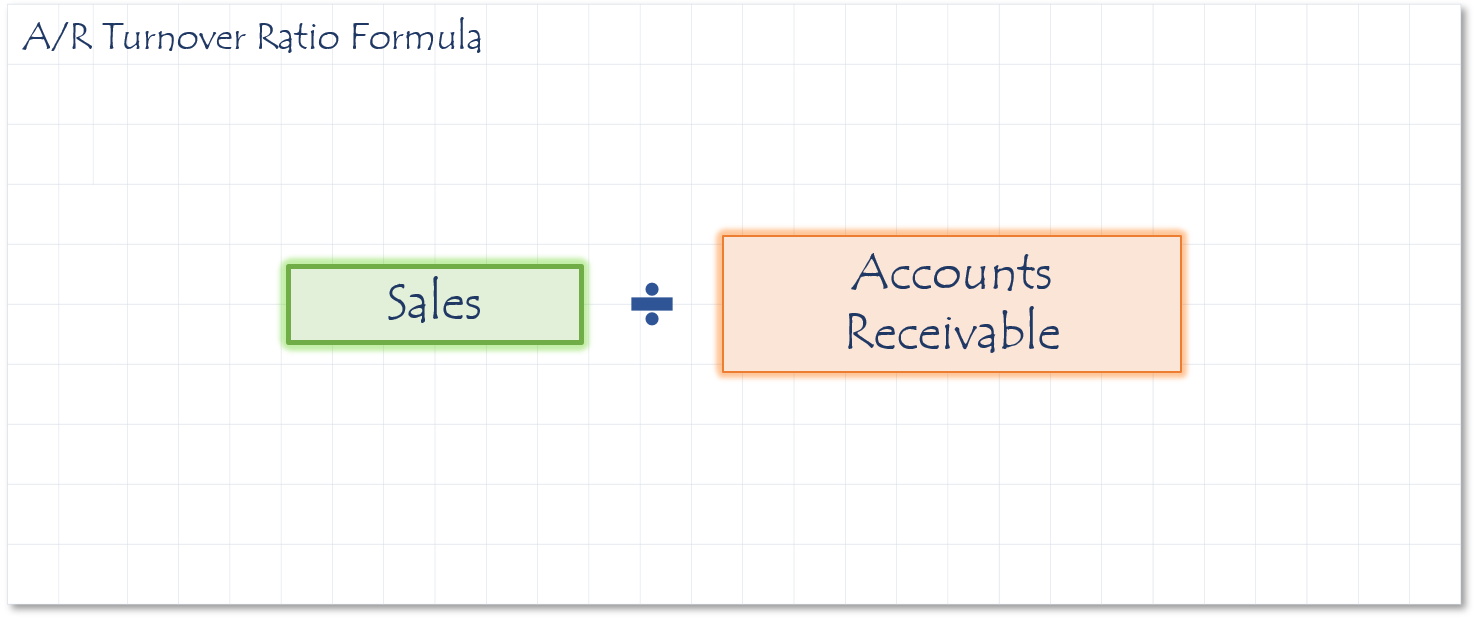
This ratio indicates how effectively the management of a company is extending and collecting on credit terms it gives it customers.
Speed is key factor in turning over receivables. Companies that extend terms to customers are giving them an interest free loan. Therefore, the longer it takes them to collect from their customers, the more money they lose based on the concept of the Time Value of Money.
This ratio states how many times a customer pays you per year on average. To covert the ratio to a number of days, divide 365 by the receivables ration.
Sources
- If the ratio is 10.9, that means that on average, the accounts receivable turn over 10.9 times per year.
- If receivables are excessive, the business’ liquidity is impaired, and this could lead to future bad debt losses. A high AR Turnover ratio indicates a potential collection problem.
- Accounts receivable is too high
- Reduce accounts receivable
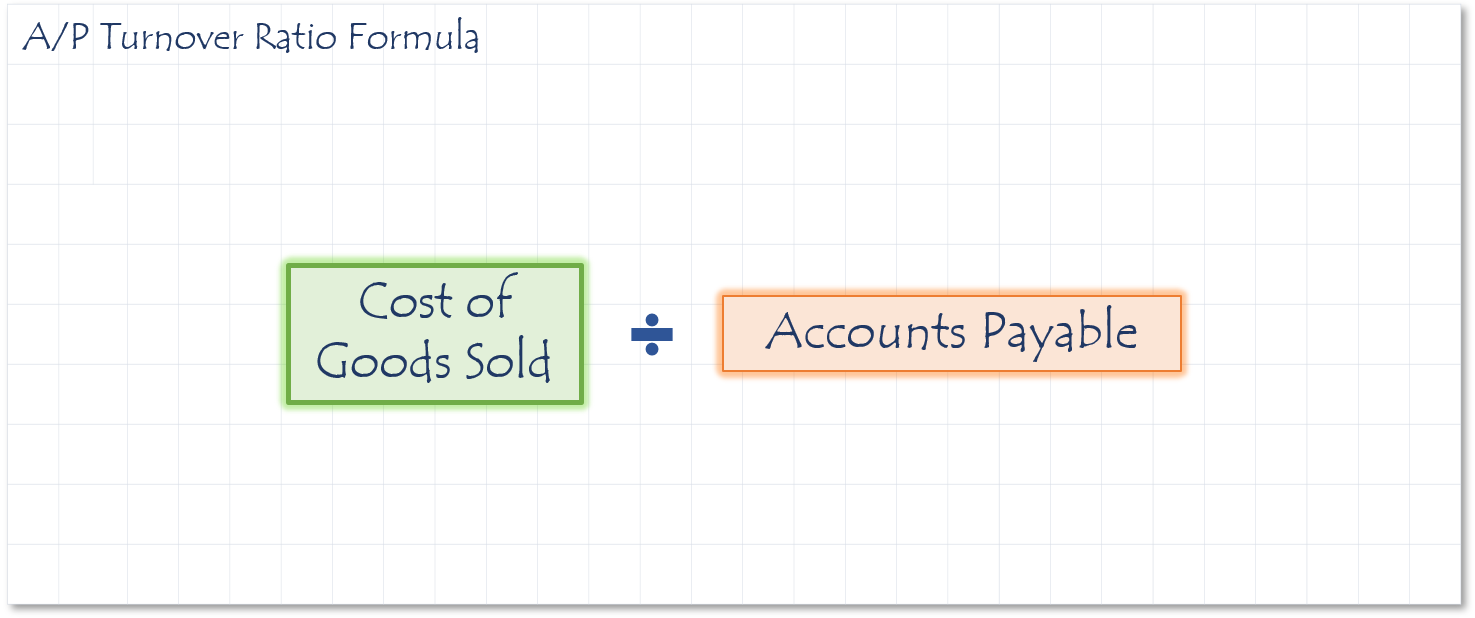
The Accounts Payable ratio expresses how quickly the company pays its suppliers for goods or services.
Sometimes company management increases its cash flow by reducing its payable turnover rate. This means that it is taking longer to pay suppliers. Trend analysis can help identify companies in this situation.
If a company “stretches” its payables too far for too long, they risk losing valuable credit terms with their vendors, or may miss taking advantage of discounts suppliers offer for faster payment. To convert the payables turnover ratio into days, divide 365 by the ratio.
Sources
- If the ratio is 6.6, that means the accounts payable turn over 6.6 times per year.
- A falling turnover indicates the business is taking longer to pay its suppliers.
- Excessive inventory and/or fixed assets (cash that could be used to pay bills is tied up in inventory)
- Reduce inventory
- Sale/leaseback some of the fixed assets
How to calculate Average Days to Collect from Customers (A/R)
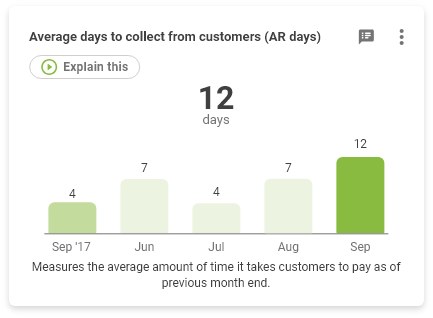
Description
Measures the average amount of time it takes your customers to pay per month.
watch video explanation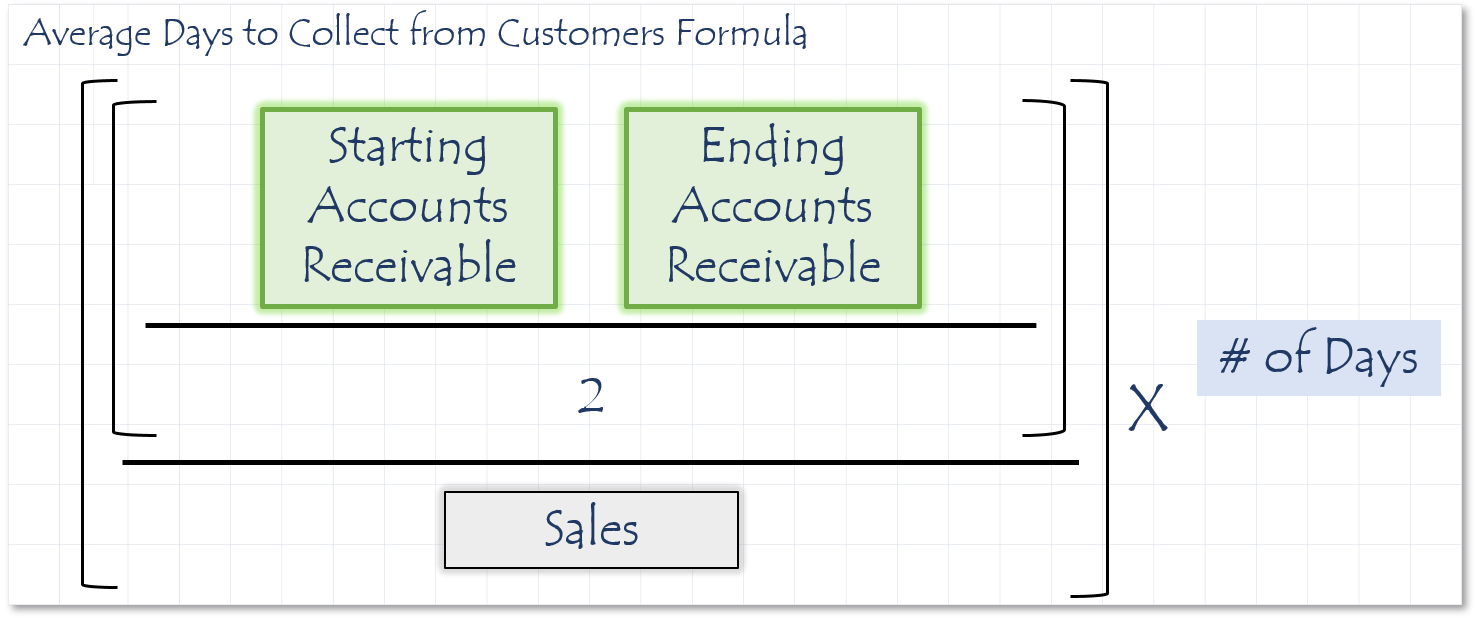
Sources
Average Days to Pay Vendors (A/P)
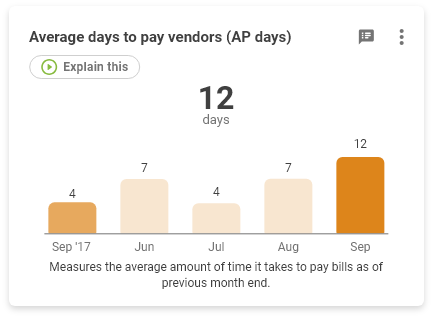
Description
Measures the average amount of time it takes to pay bills per month.
watch video explanation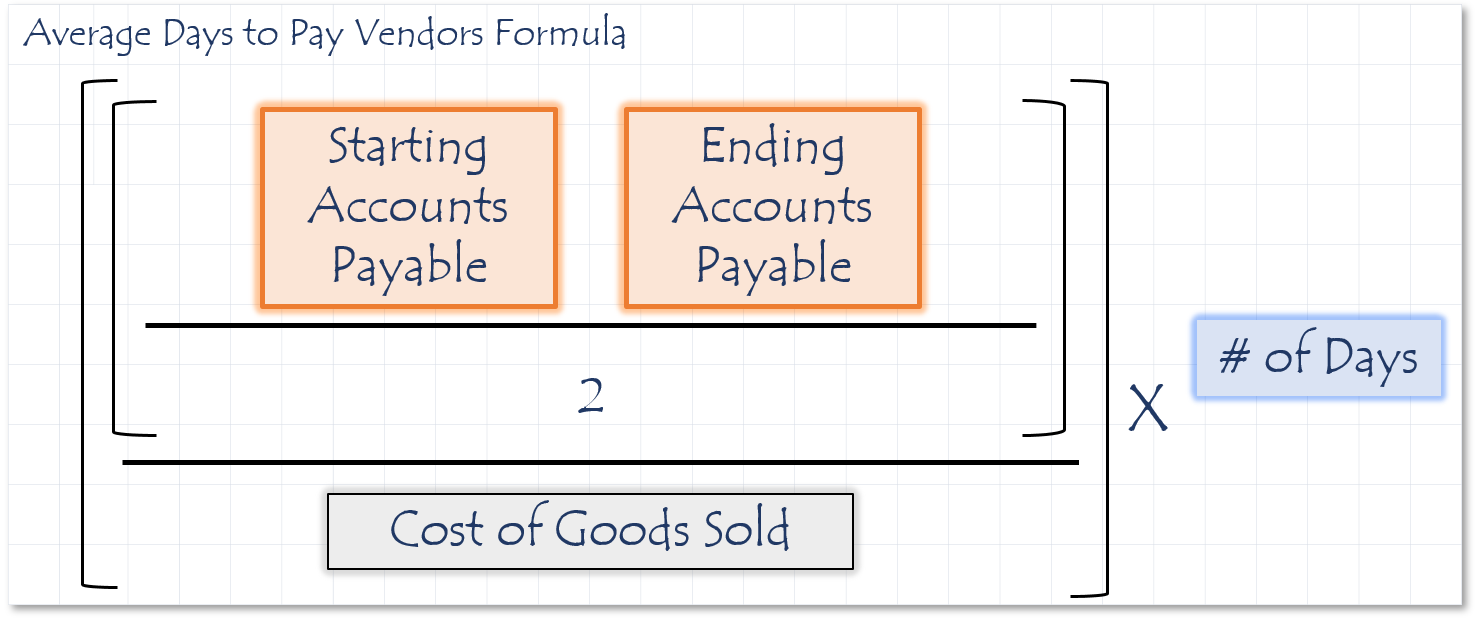
Sources
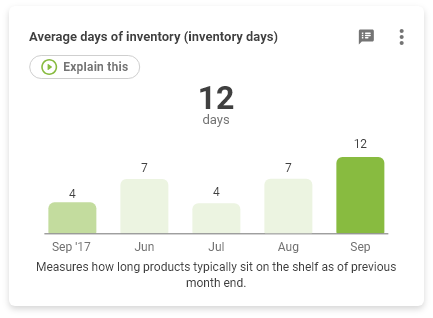
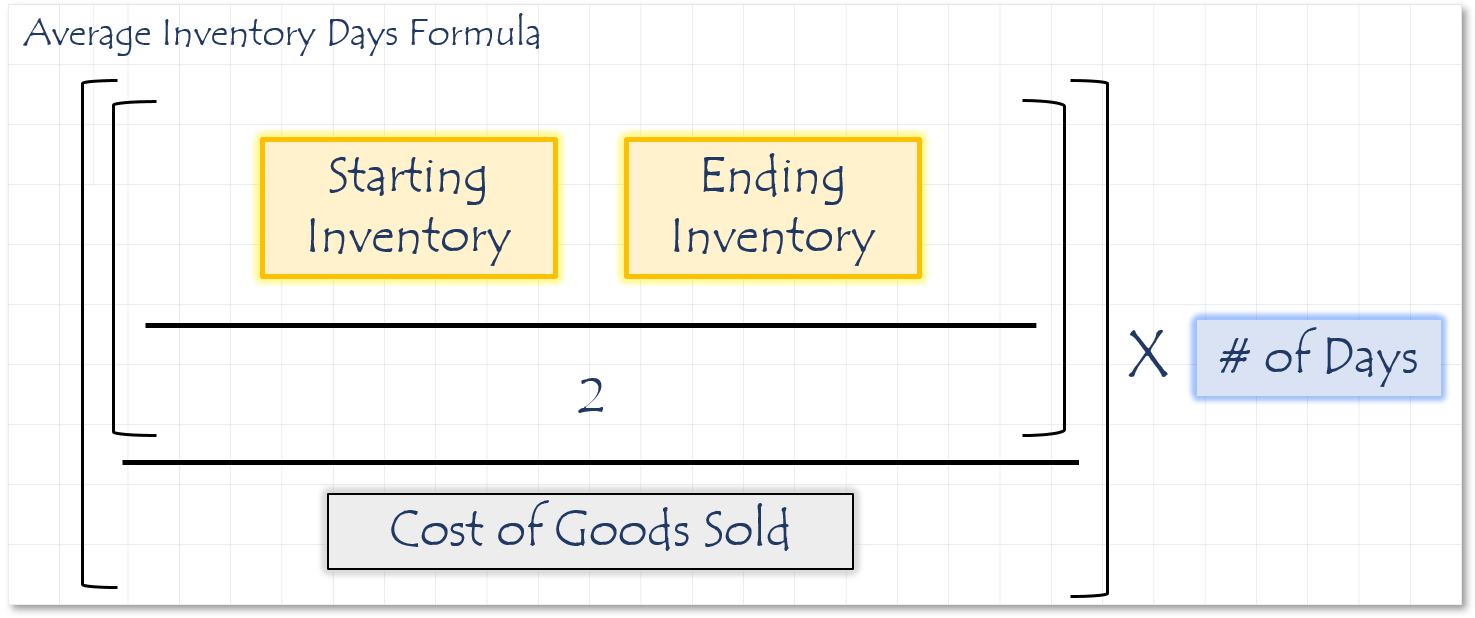
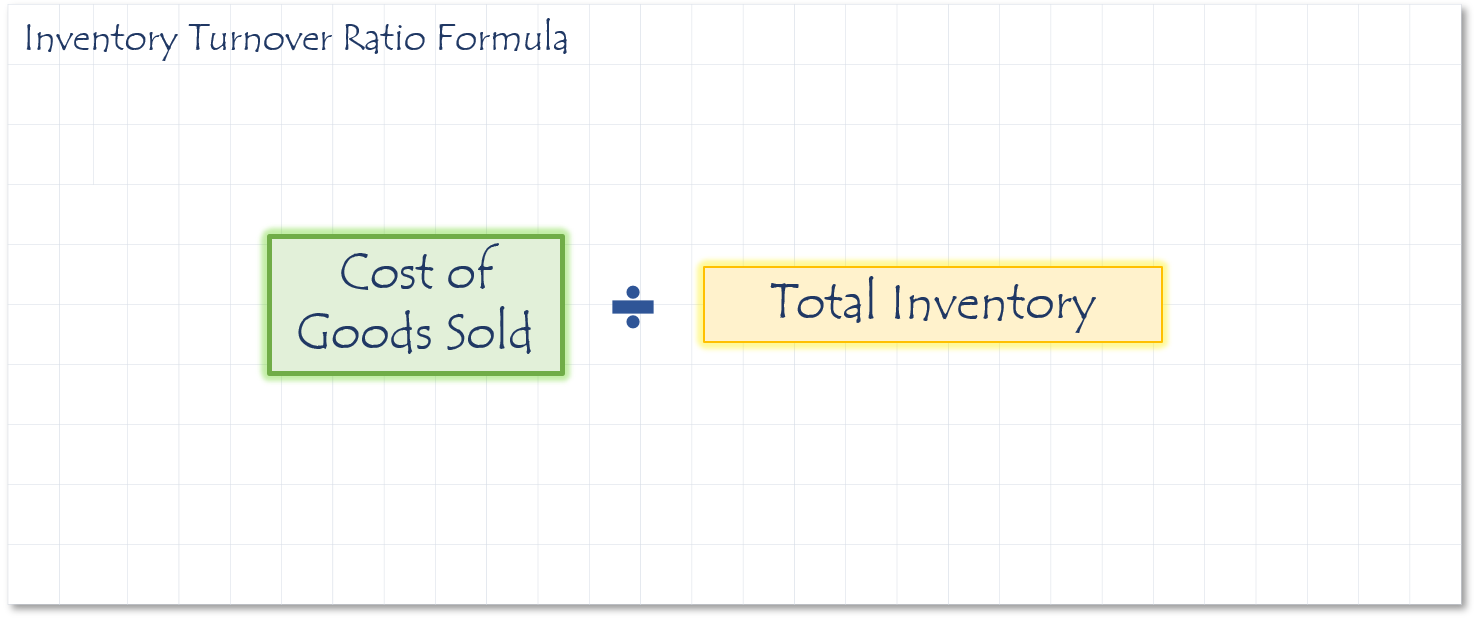
Inventory turnover measures how many times a company’s goods are sold and replaced over a given period. This is a speed calculation converted to number of days for context. To convert divide 365 by the inventory turnover ratio. Some analysts divide the inventory by sales to determine turnover. Many prefer to use COGS. Sales are recorded at market value and COGS is recorded at actual cost. Low inventory turnover implies that the company has a sales problem and does not move their inventory as fast as their competitors.
Sources
- If the ratio is 4, that means the inventory turns over 4 times per year.
- A low inventory turnover ratio suggests that there may be excess inventory on hand. Excessive inventory can cause insufficient liquidity and can reduce profitability due to high inventory holding costs. Inventory levels must be managed on a month-by-month basis in order to ensure that they stay at appropriate levels.
- Current inventory stock is too high
- Reduce inventory on-hand (calculate appropriate inventory by dividing cost of goods sold by the industry average inventory turnover rate)
How to calculate Cash needed to close cash gap
Cash Gap
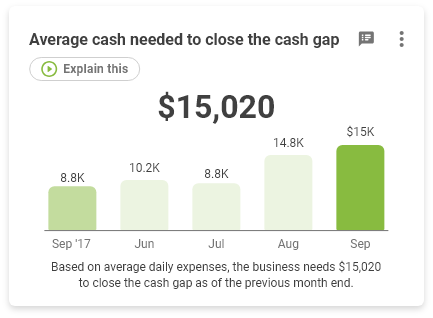
Description
The amount of money needed to operate your business while awaiting for money to come in from customers and we have already paid your vendors.
watch video explanation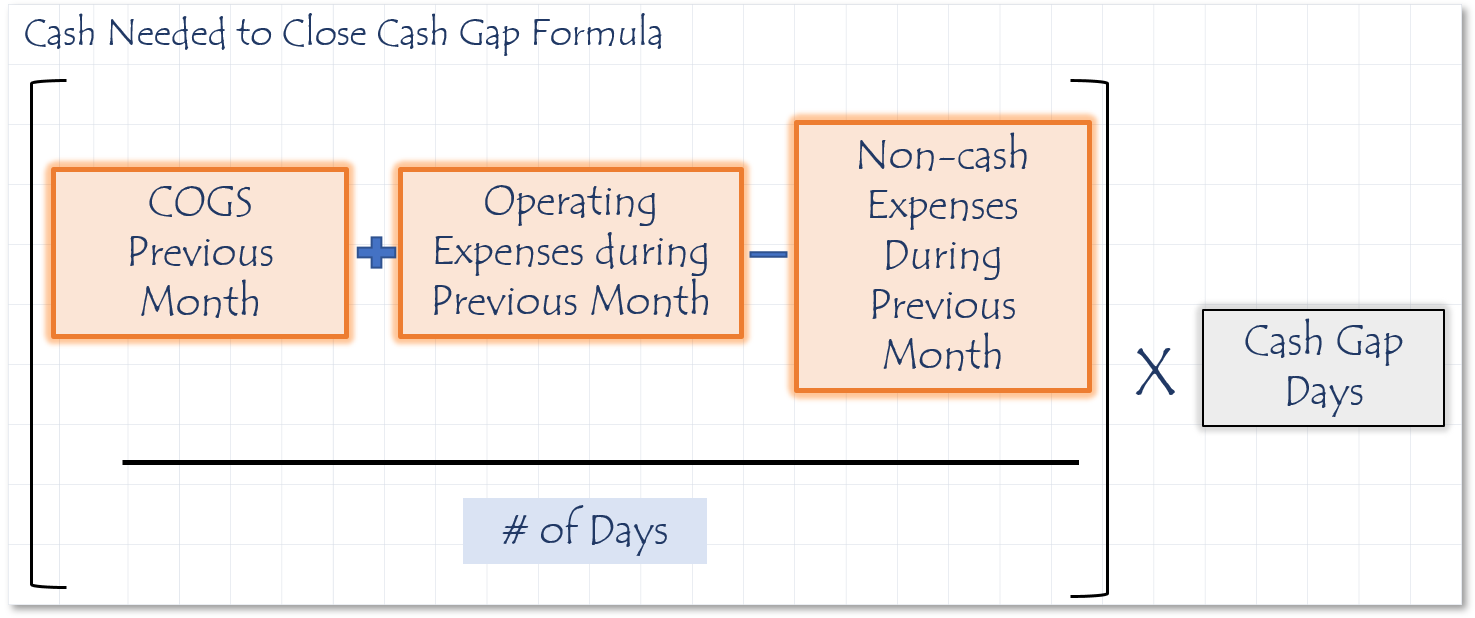
Sources
How to calculate Cash Gap Days
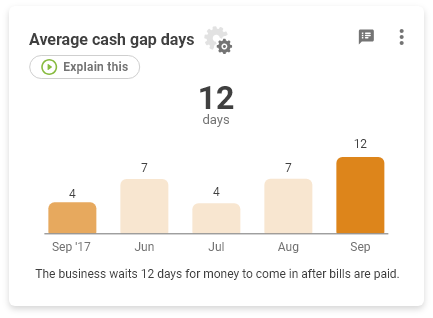
Description
The amount of time you are waiting for money to come in from your customers for inventory you have already purchased.
watch video explanation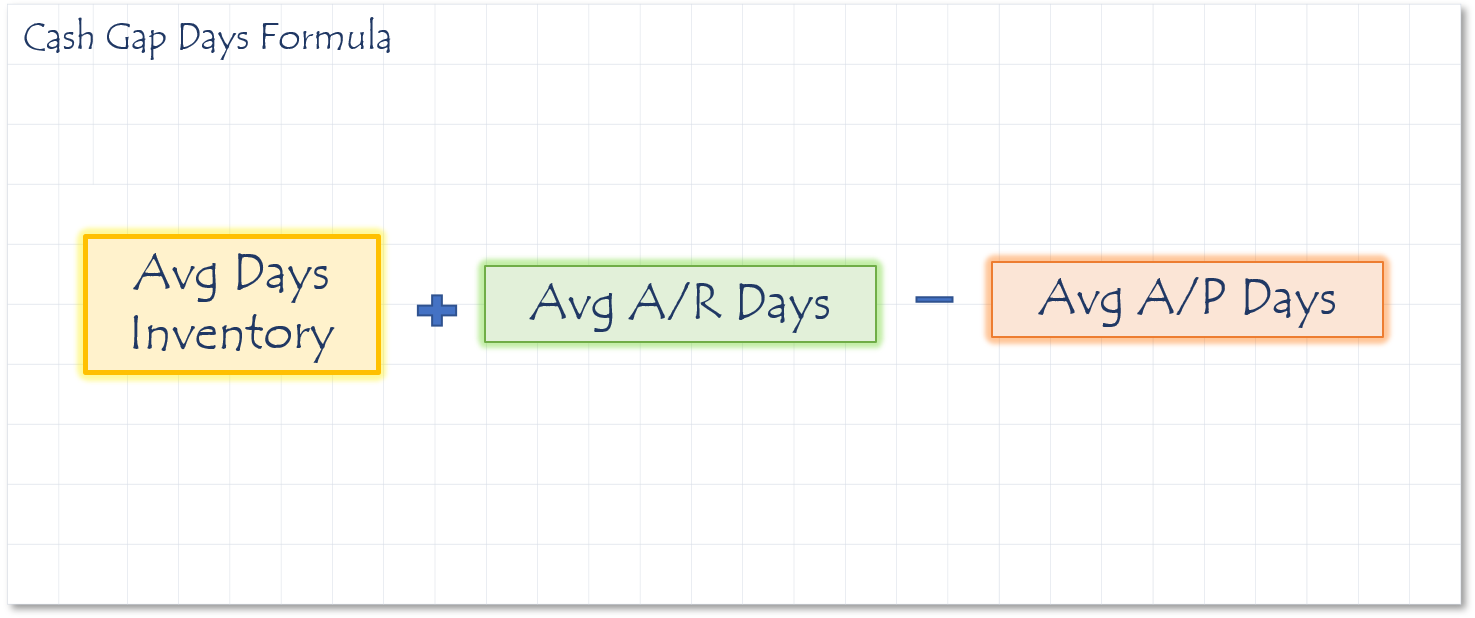
How to calculate Cash Shortage
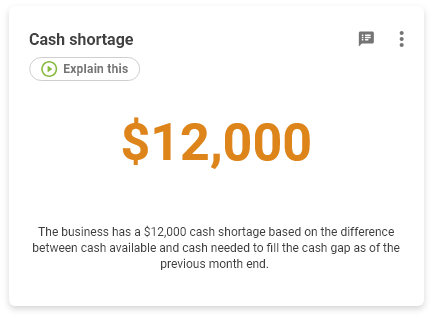
Description
Measures if you have enough money to keep operating during your working capital cycle.
watch video explanation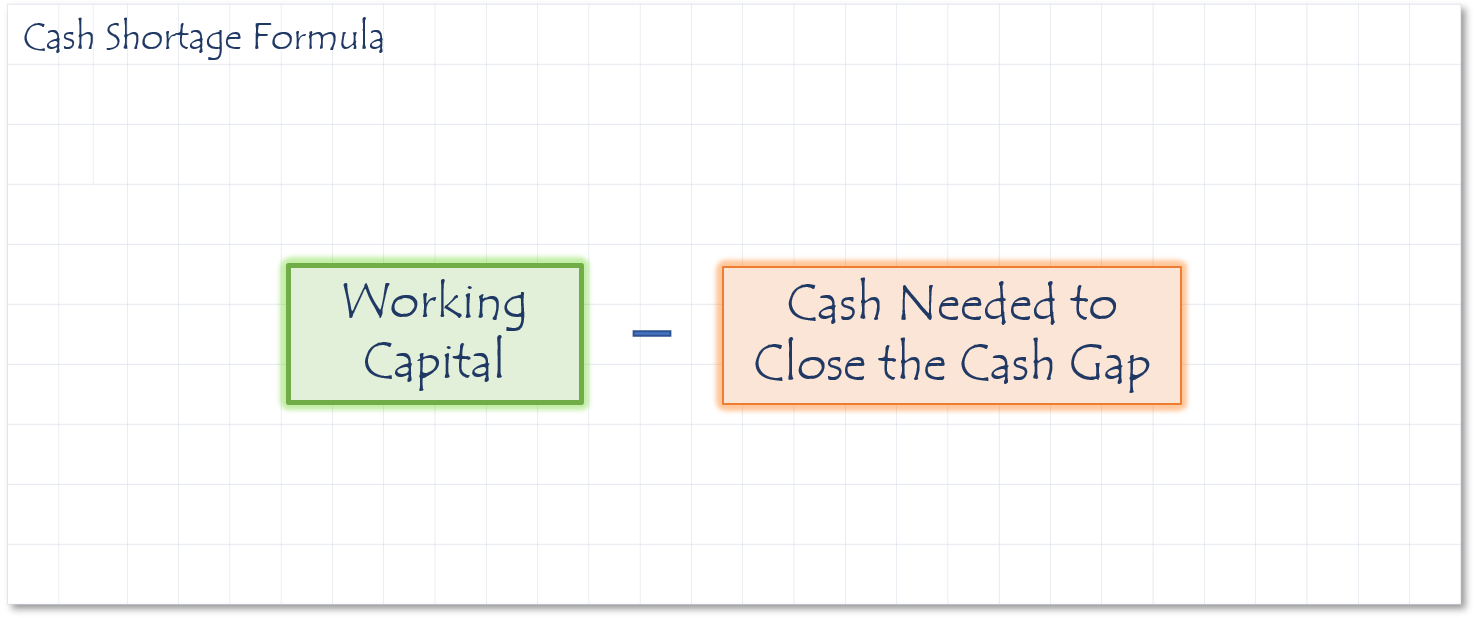
How to calculate Current Ratio
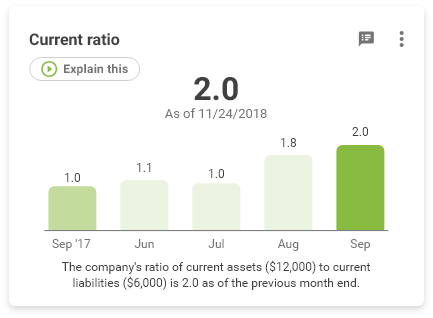
Description
The current ratio measures your company’s ability to support itself. It asks the question of whether a company can pay back its liabilities with its assets.
watch video explanation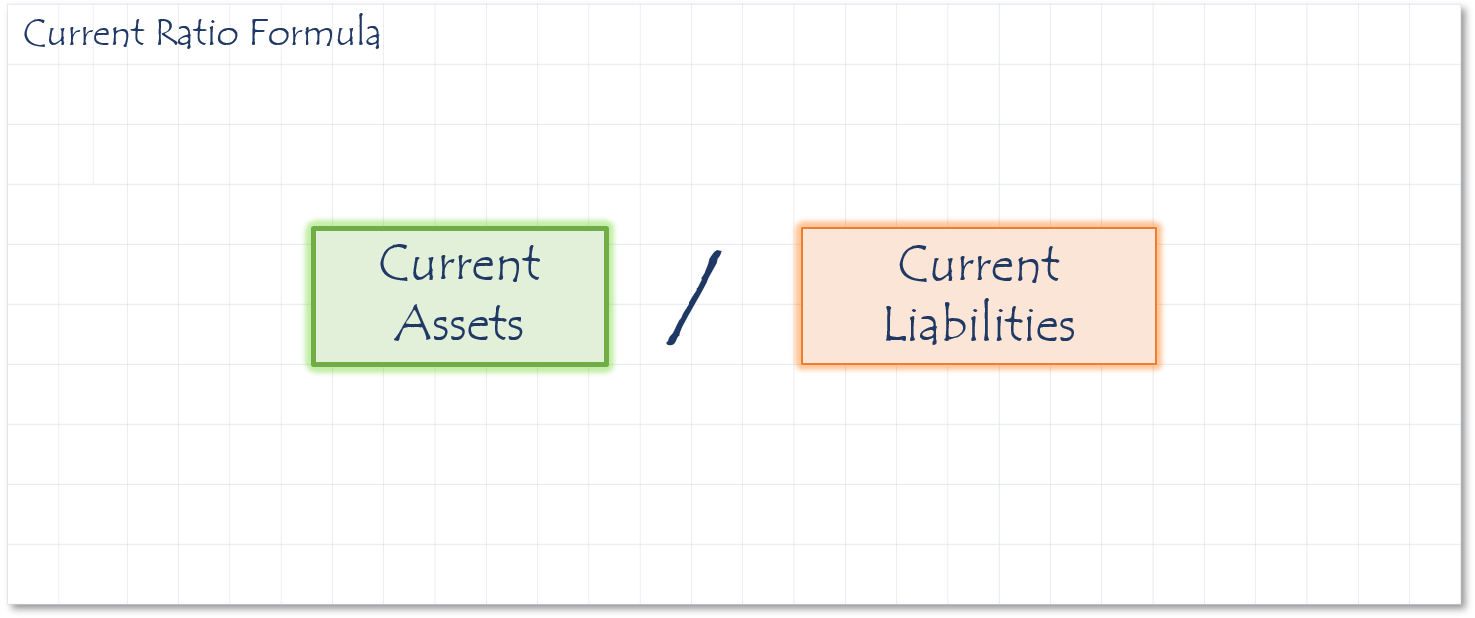
Sources
Meaning
If the ratio is 1.35, that means there is $1.35 in current assets to pay every $1.00 in current liabilities.
Why you careA low current ratio indicates low solvency for the business.
Possible Causes of a Low Current RatioEither current liabilities are too high, or you're using short term funds (current liabilities) to fund long term assets.
Potential SolutionsEither Move some short term liabilities to long term, or sell/leaseback some of the fixed assets.
Extra
- It is generally concerned with assets that can be converted to cash within the next 12 months.
- It’s known as a liquidity ratio, which means how easily can you turn something into cash.
- It includes all current assets like inventory, accounts receivable and checking accounts, as well as all current liabilities like accounts payable, lines of credit and credit card balances.
To calculate it, you divide your total current assets by your total current liabilities. The higher his number is the better, but you should always strive to have a current ratio over 1. A good goal is to shoot for a current ratio of 2 or whatever your industry average is. Any number below 1 is an indication you can’t pay your obligations and are in poor financial health.
How to calculate Days Cash On Hand
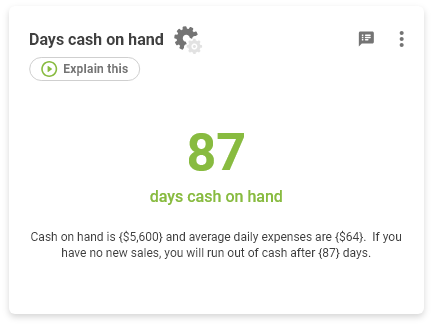
Description
Shows how much cash on hand do you have to pay for expenses assuming no new sales.
watch video explanation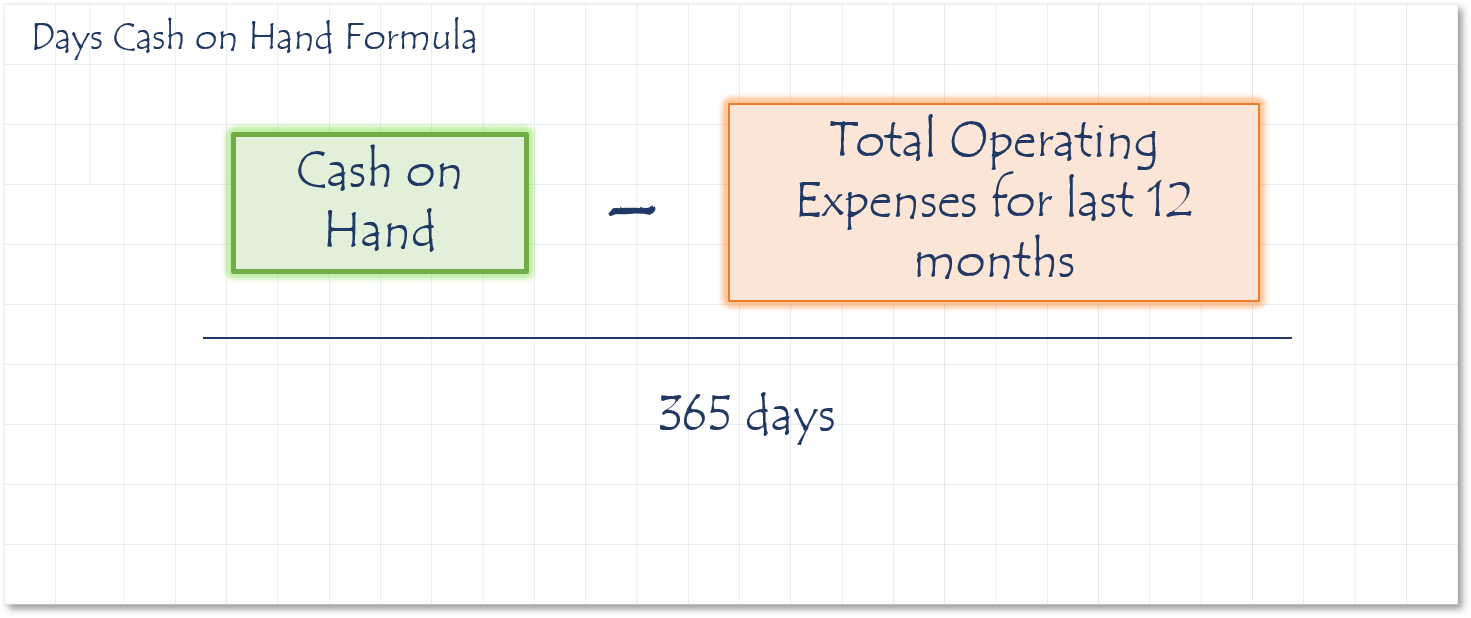
Sources
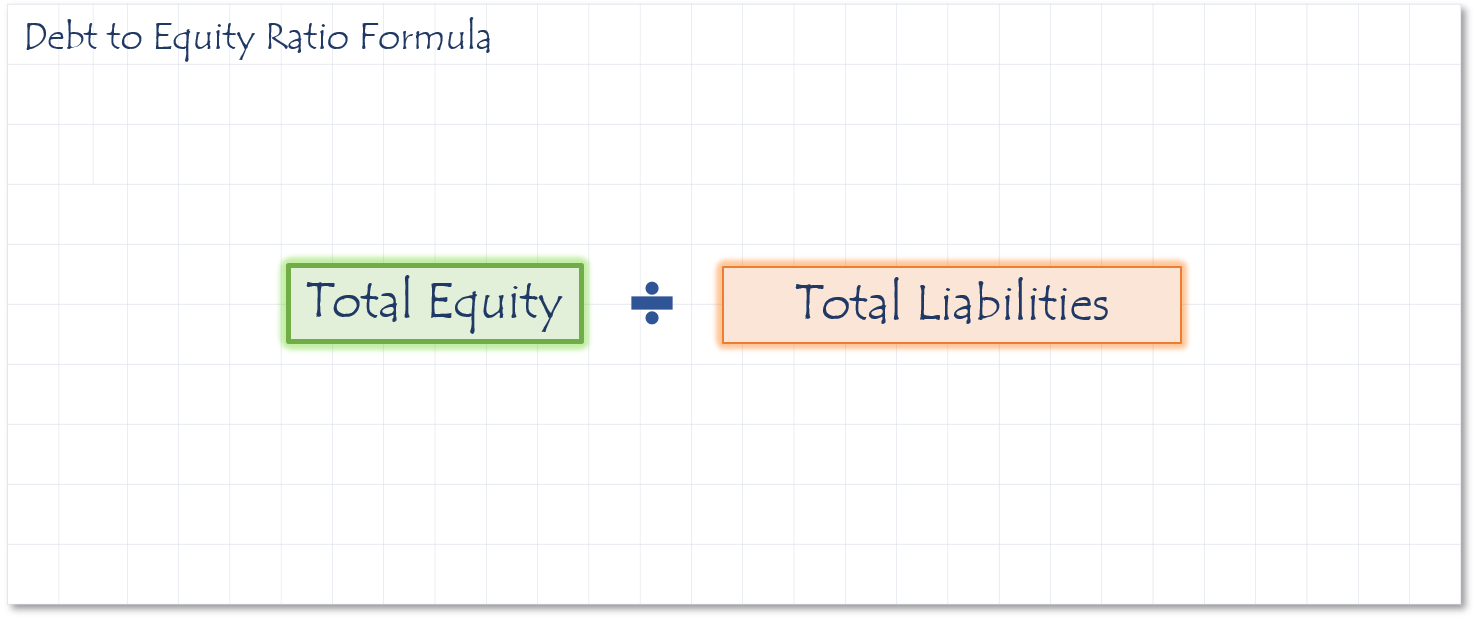
This ratio is an indication of the proportion the company is funded with debt in relation to equity.
A low debt to equity ratio indicates the company’s shareholders believe in the company and reinvest in it. It may also indicate they have not taken advantage of the increased profit that financial leverage can create.
A high debt to equity ratio indicates that the company may not be able to generate enough cash to meet debt obligations, which may hinder their efforts to secure debt in the future.
Sources
- If the ratio is 1.45, creditors have put $1.45 in the business for every $1.00 the owners have put in.
- A high Debt/Equity ratio indicates low safety for the business.
- Equity too low
- Liabilities too high
- Add to capital (sell stock)
- Slow growth in order to let profits reduce liabilities instead of purchasing additional assets
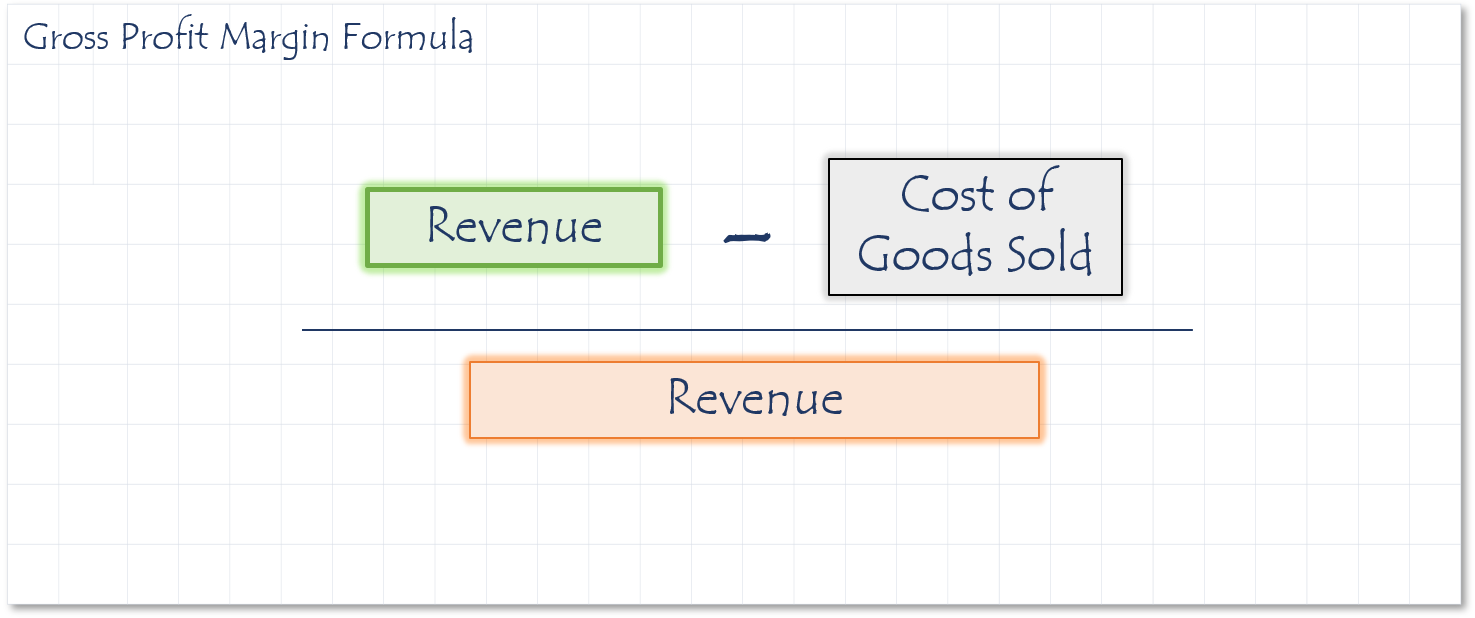
How to calculate Gross Profit Margin
Gross profit margin is extremely important for maintaining the profitability of any business. Even a slight variation in the gross profit margin can have a large impact on the net profit.
Sources
- If the ratio is 30.7%, for every $1.00 in sales there is $0.307 in gross profit.
- Poor pricing
- Poor buying
- Poor product mix
- Poor production
- Spoilage, shrinkage, etc.
- Do not offer discounts
- Take trade discounts
- Change production costs
- Reduce production costs
- Monitor inventory more closely
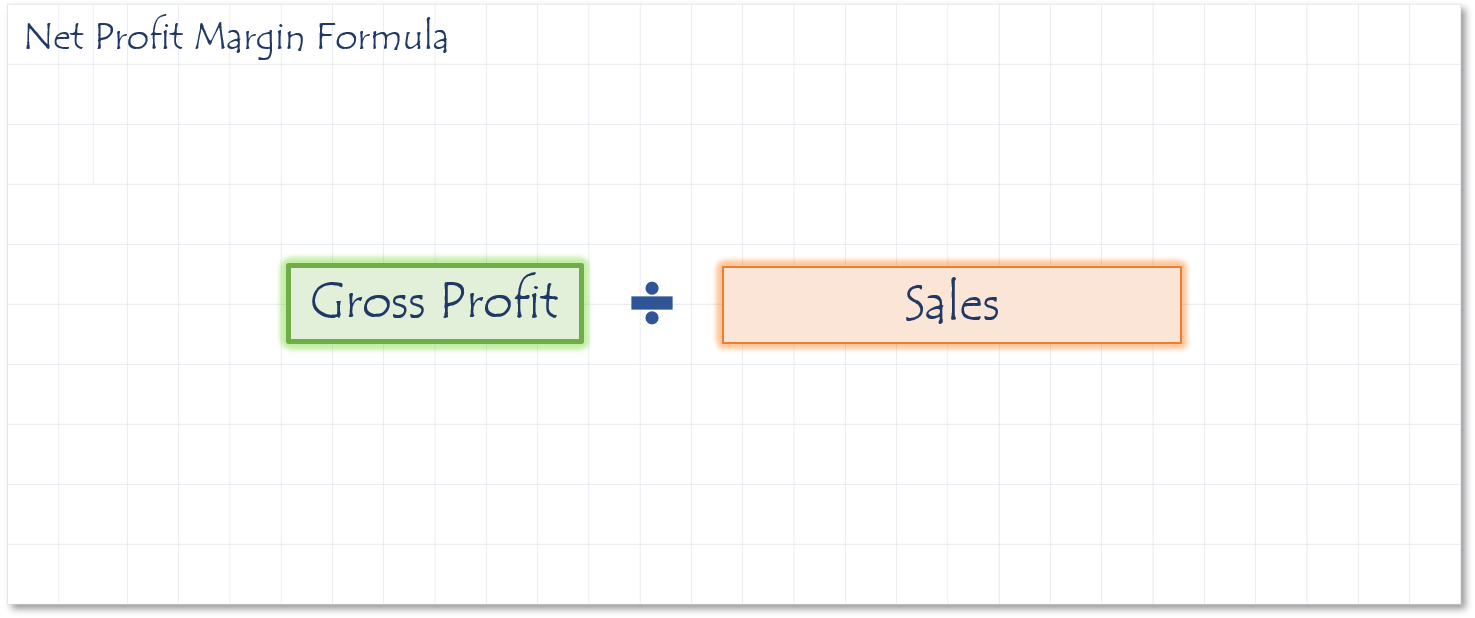
Profit margin is a percentage after operating expenses but before taxes. It shows what percentage of the sales dollar is profit before taxes.
Sources
- If the ratio is 14%, for every $1.00 in sales there is $.14 in pre-tax profit.
- Low gross profit margin
- Overhead too high
- Do not offer discounts
- Take trade discounts
- Change sales mix
- Reduce production costs
- Monitor inventory more closely
- Reduce overhead
How to calculate Quick Ratio
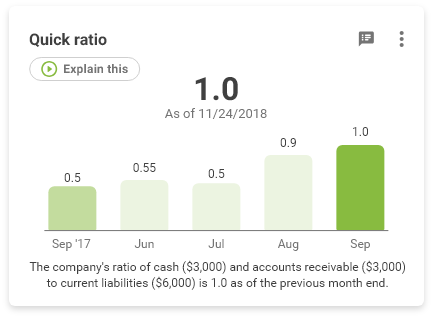
The quick ratio tells you how much Cash and AR you have to cover your current liabilities.
watch video explanation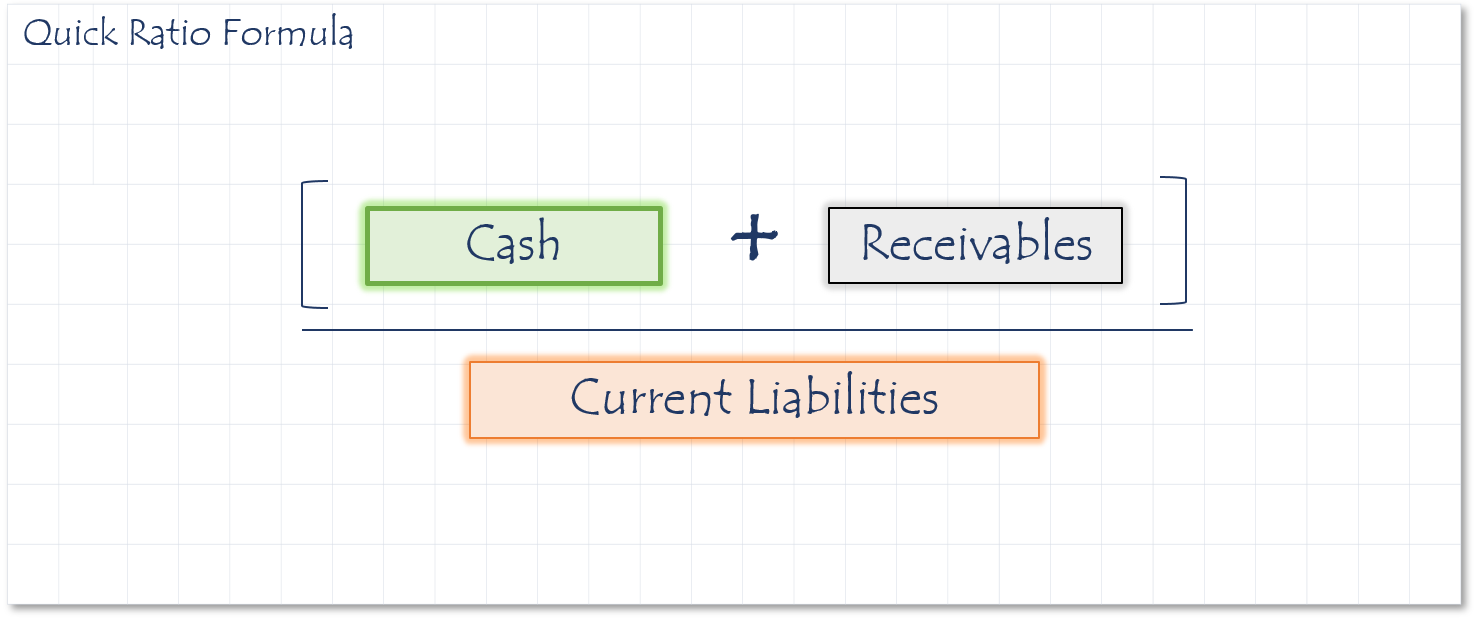
Sources
Meaning
The quick ratio is another way of measuring your company’s ability to convert its assets to cash. Sometimes called the acid test, it points out the good companies from the bad, just like during the gold rush acid was used to tell real gold from fools gold. In this case, we are answering the question of how much could your get from your company’s assets in the next 90 days. It’s calculated by taking cash + A/R and dividing the result by your current liabilities. In this case we don’t use assets like inventory, which we might not be able to sell in 90 days without a significant discount, or pre-paid expenses, since most of the time you aren’t able to get that money back. The target you should be aiming for here is a ratio of 1.0.
- If the ratio is 0.49, that means there is $0.49 in quick (liquid) assets to pay every $1.00 in current liabilities.
- A low quick ratio indicates low safety for the business.
- Current liabilities are too high
- Using short term funds (current liabilities) to fund long term assets
- Inventory is too high
- Move some short term liabilities to long term
- Sale/leaseback some of the fixed assets
- Reduce inventory
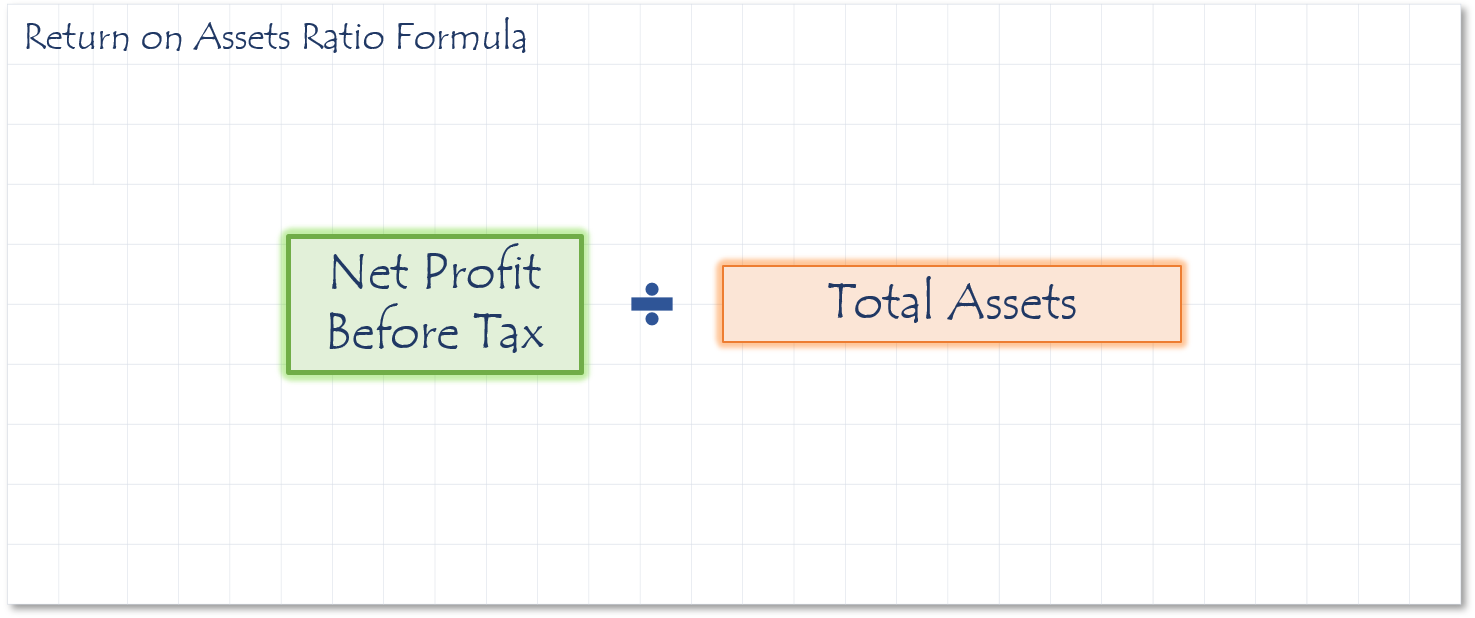
This ratio is a measurement of how efficient the management of the company is using their assets to generate profit. This ratio is used to evaluate the effectiveness of the company’s money. To get the best use from the ROA ratio, it should be compared to the return on assets that other companies in similar industries are experiencing.
Sources
- If the ratio is 0.3%, there is $0.003 in profit for every $1.00 in assets employed in the business.
- Low pre-tax profit
- High assets
- High equity
- Increase sales
- Reduce expenses
- Reduce accounts receivable
- Reduce inventory
- Expand business using borrowed funds
- Sell unnecessary property
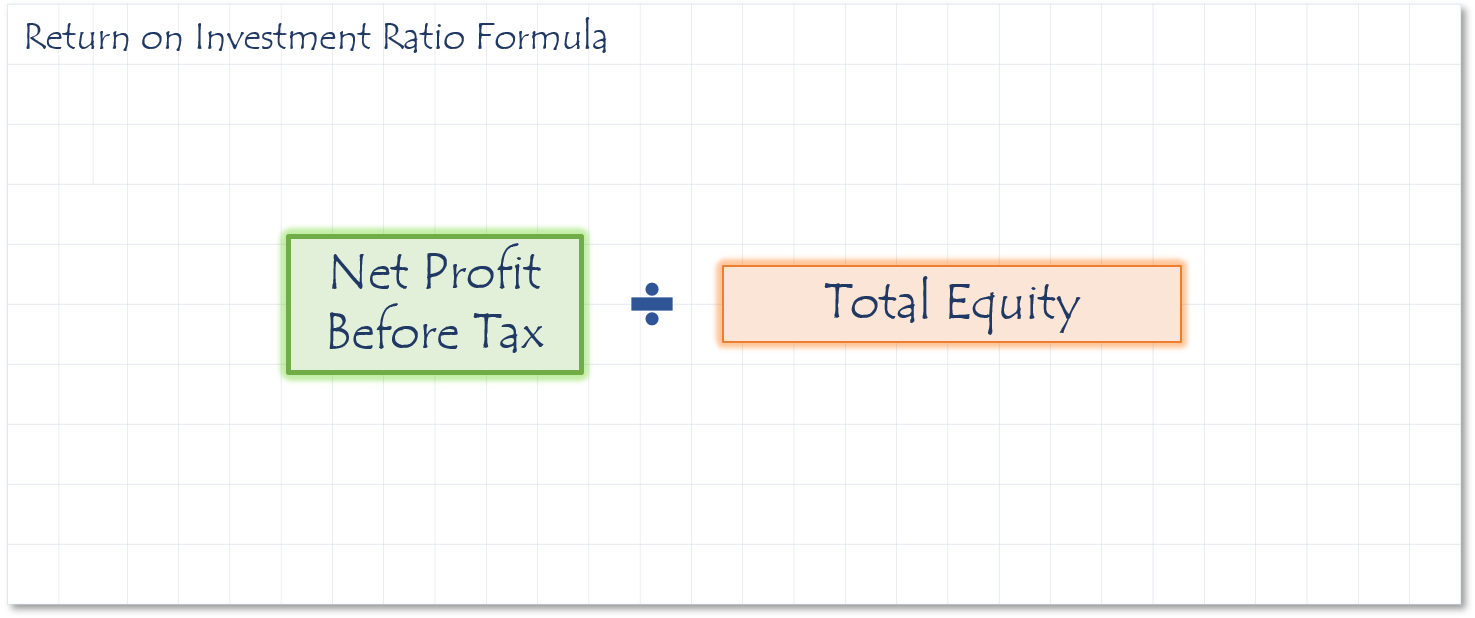
How to calculate Return on Investment Ratio
This ratio measures the efficiency of the stockholder’s decision to invest in a company relative to its cost. This ratio is expressed as a percentage and is easily compared to other options the stockholder had to invest their money. One of the main complaints about the ROI ratio is that it ignores the timeframe of the investment. In order to compare more accurately to other investments, you must divide the ROI percentage by the duration that the investment was held.
Sources
- If the ratio is 0.3%, there is $0.003 in profit for every $1.00 in equity invested in the business.
- Low pre-tax profit
- High equity
- Increase sales
- Reduce expenses
- Expand business using borrowed funds
- Buy back equity from investors
How to calculate Sales to Assets Ratio
This ratio is also known as the Asset Turnover Ratio. It compares the ratio of sales generated by a company relative to the value of its assets. It is best used when comparing companies in similar industries. The higher Sales to Assets ratio indicates the company was more efficient at using its assets to generate revenue. The ratio isn’t as effective in comparing companies in different industries. It is possible for a company to have a small asset base, but still generate a lot of revenue. Walmart is an example of this.
Sources
- If the ratio is 1.98, that means there is $1.98 in income for every $1.00 in assets employed in the business.
- A low Assets ratio indicates that the assets of the business are not providing adequate revenue.
- Low sales volume
- Assets invested in the company are too large
- Increase sales by increasing accounts receivable and/or increasing inventory
- Reduce excess inventory (reducing assets)
- Sell or leaseback some fixed assets
- Sell unnecessary property