Your clients are busy running their business and their job is to focus on what matters. Most of the time this involves completing daily tasks, which leaves little time on assessing the health of their business. Too often assessing the health of their business occurs infrequently and only when there is a problem.
This month, we introduced the all-new Summary screen which offers a quick overview-at-a-glance of business for the last 7 days and the next 7 days. One major aspect of the Summary screen is the introduction of the CashGuardian™ built-in service that is designed to automatically sift through all of the data and surfaces what matters most to a business.
This blog will show you how to use the CashFlowTool Summary screen to quickly track the health of the business once a week. By spending a few minutes each week looking at the last 7 days and what is coming up in the next 7 days, you and the business owner will be well positioned to know the health of the business and potentially avoid costly surprises.
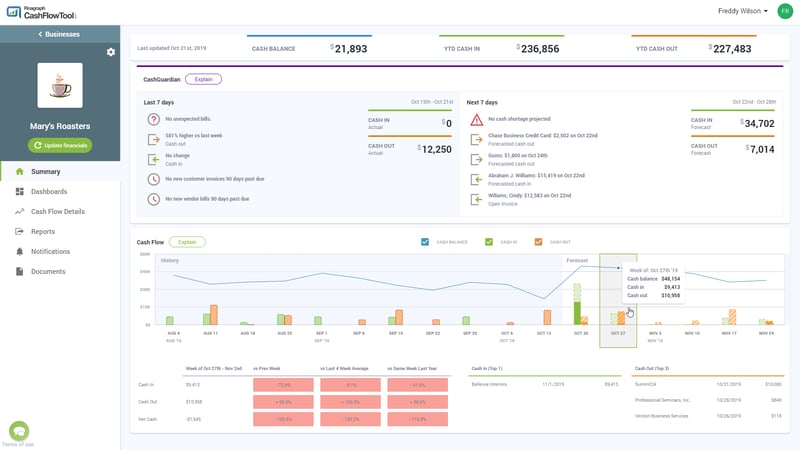
The new CashGuardian service that watches out for anything out of the norm and alerts it. It sifts through all the data and surfaces the most important things so you are aware and can either take action or be assured that things are running smoothly. CashFlowTool automatically synchronizes the data with QuickBooks on a weekly basis and so you will always see what happened the last 7 days and the next 7 days ahead.
Last 7 Days
|
CASH IN AND CASH OUT Cash in and Cash out shows you all the cash that came into your business and all of the cash that went out of your business for the period. This is based on all the transactions that impacted your cash. |

|
|
 
|
Cash in/out versus last week You can see how this number compares to the previous 7 days and determine if your cash out and cash in is increasing or decreasing since the previous week. While we show you a quick stat at a glance, business owners will most likely already have an idea what the numbers should be. If the cash in or out percent change number is higher or lower than you expected, then this is your opportunity to drill down and ask questions. By asking good questions, you will be able to grow your business and avoid surprises. Keep in mind, an increase in expense may not be bad for your business. For example, last week you purchased more inventory for your business which will help generate more sales. By glancing at the Cash Flow chart below CashGuardian, you can see how your expenses from the last 7 days, compares to previous weeks. If you see a steady rise in cash out, without a corresponding rise in cash in, then this means you need to dig in more. |

|

|
Unexpected bills CashGuardian checks for unexpected bills by scanning through the last 12 months of transactions and looks for transaction amounts that are significantly greater than past payments made. If it finds any, it will show the top unexpected bill. The Unexpected Bills card on the dashboard will show the top 5 unexpected bills. |

|

|
Customer Invoices You work hard to perform a valuable service to your customers, and you expect to get paid in a timely fashion. Sometimes customers fall behind making payments. CashFlowTool automatically lets you know if you have new customers that cross the 90 days threshold. If the number of customers hitting this threshold each week increases, this may indicate a problem that needs further investigation. It is estimated the customers & vendors that are past 90 days old only have less than 75% chance of being paid so it’s important to stay on top of the invoices crossing this threshold. |

|
|
Vendor Bills The same is true for vendor bills that cross the 90-day threshold. Having bills greater than 90 days past due can negatively impact your business credit score, likelihood of receiving a line of credit and business reputation. |

|
YOUR ACTION LIST:
- Ensure you have no unexpected bills and understand why a bill is higher than expected when you do.
- Check that the percentage of cash-out last week’s matches your expectation. If the number is higher or lower than you expect, ask questions.
- Check that the percentage of cash-in last week matches your expectations. If the number is higher or lower than you expect, ask questions.
- Keep tabs on the number of customers that are crossing the 90 days due threshold. Have an action plan how to collect from these customers and reducing the number of customers that cross this threshold.
- Keep tabs on the number of vendors that are crossing the 90 days due threshold.
Next 7 Days
CashFlowTool automatically generates a Cash Flow Forecast and CashGuardian alerts you to any issues.
|
CASH IN AND CASH OUT This includes transactions that CashFlowTool has forecasted to occur based on past transactions from the last 12 months and open invoices in QuickBooks. Select the week on the Cash Flow chart to see the top 3 cash-in and cash-out transaction for the next week. |

|
|

|
Cash shortage Cash shortage lets you know if cash on hand goes below 0 in the next 7 days. While your forecasted cash-in maybe less than forecasted cash-out, its still possible to dip below zero within the next 7 days. |

|
|
|
Top 2 Cash-out transactions Shows your top 2 cash-out transactions forecasted for the next 7 days. Select each week in the chart to see top 3 cash-in and cash-out transactions. |

|
|
|
Top 2 Cash-in transactions Shows your top 2 cash-in transactions forecasted for the next 7 days. Select each week in the chart to see top 3 cash-in and cash-out transactions. |

|
YOUR ACTION LIST:
- Be aware of projected cash shortages.
- Transfer funds from another account to avoid undraws
- Collect payments from customers
- Delay payment to vendors
- Secure a line of credit
- Review cash in / out amounts and ensure these match your expectations
- Using the cash flow chart, you can drill down and see additional details if needed
- Review the top 2 cash in / out transactions to ensure they look valid
- Using the cash flow chart, you can drill down and see additional details if needed
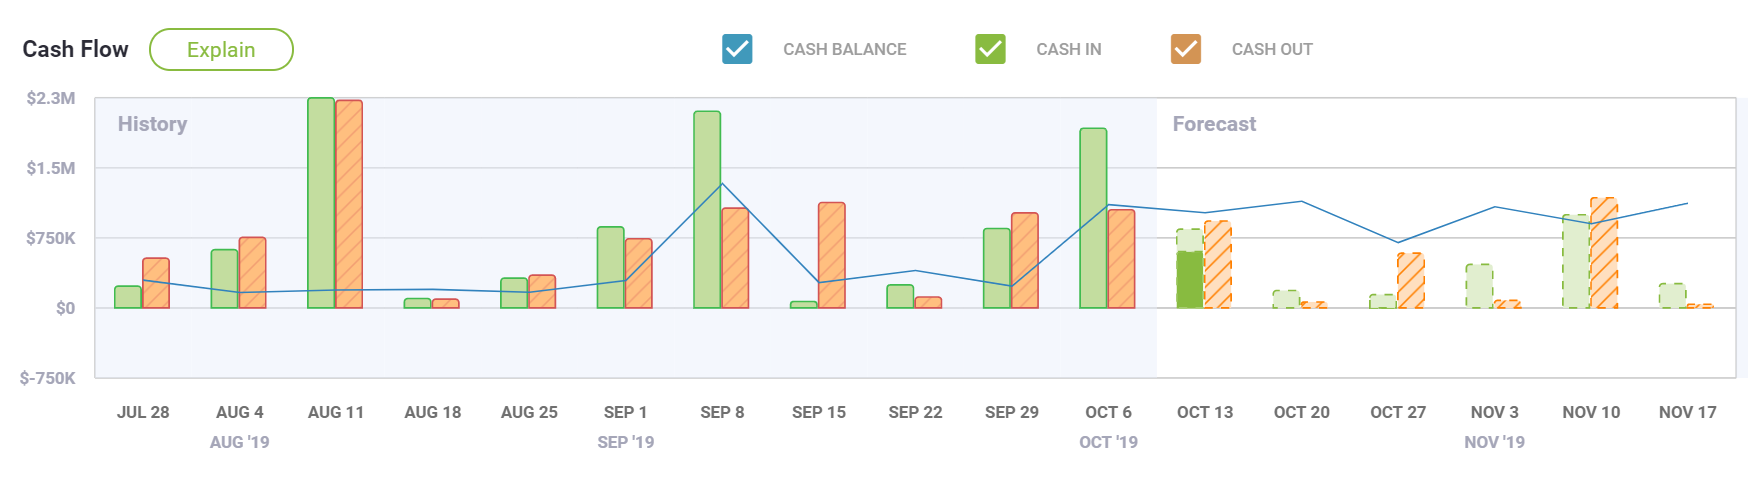
 Cash Flow Chart
|
Cash Flow Chart The Cash Flow Chart shows the last 12 weeks of actuals and the next 4 weeks of forecasted transactions. At a glance, you can see how your cash balance, cash-in and cash-out amounts are trending over time. By clicking each week in the chart you can drill down and see additional details for each week.
|
YOUR ACTION LIST
- Review past and future cash-in and cash-out amounts and ensure they are in-line with your expectations.
- Click into each week to see the top 3 cash-in and cash-out transactions for each
- Compare performance of the week selected to the previous week, last 4 week average and last year
Author

Michael Patten
Michael is the Lead Product Manager for CashFlowTool where he oversees the product development team, feature set and overall product direction.