Back to blog list
Chart-Interactive-new

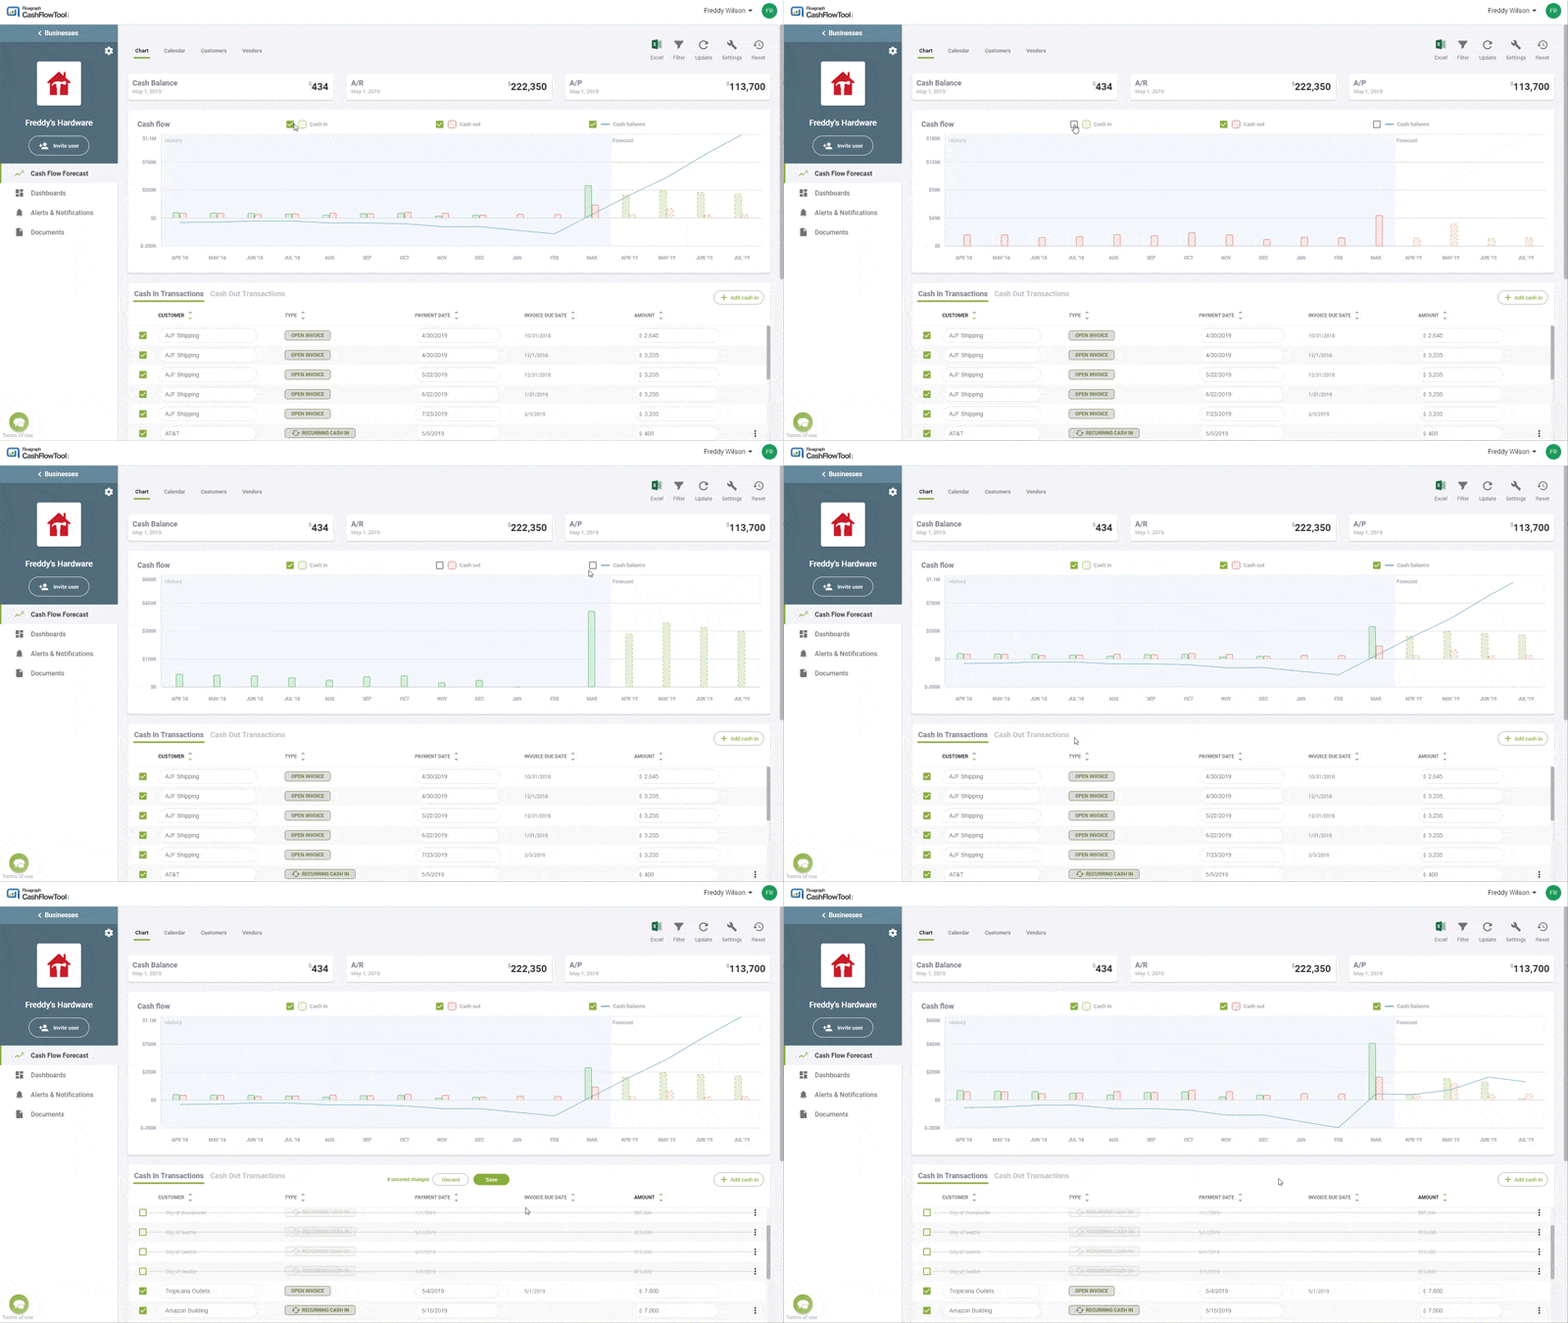
CashFlowTool's new interactive chart forecasting feature

This month we rolled out a powerful new feature enabling you to see your cash balance trend, overlaid with cash ins and outs over the past year and your 90 day future forecast.   It's a great new way to visualize your forecast.

Read more about this powerful new feature and see the feature in action.

We hope you enjoy this new enhancement this month as we continue to work hard to improve CashFlowTool.   If you have feature requests or suggestions, please email us @ team@cashflowtool.com
About CashFlowTool.com

CashFlowTool is a product developed by Finagraph. We're a technology company that's passionate about helping small business owners, accountants, and lenders deeply understand the financial health of companies. Finagraph’s trusted technology helps power services provided by companies including Moody’s Analytics, Jack Henry & Associates and leading banks. Learn more


(206) 922-4502

15500 SE 30th Pl #101, Bellevue, WA 98007

© Finagraph. All Rights Reserved.