All-new interactive chart:
visualize your future today!
Observe your cash balance trend, overlaid with cash ins and outs over the past year, and forecasted 6 months in the future.
_optimized.gif)
See it in action
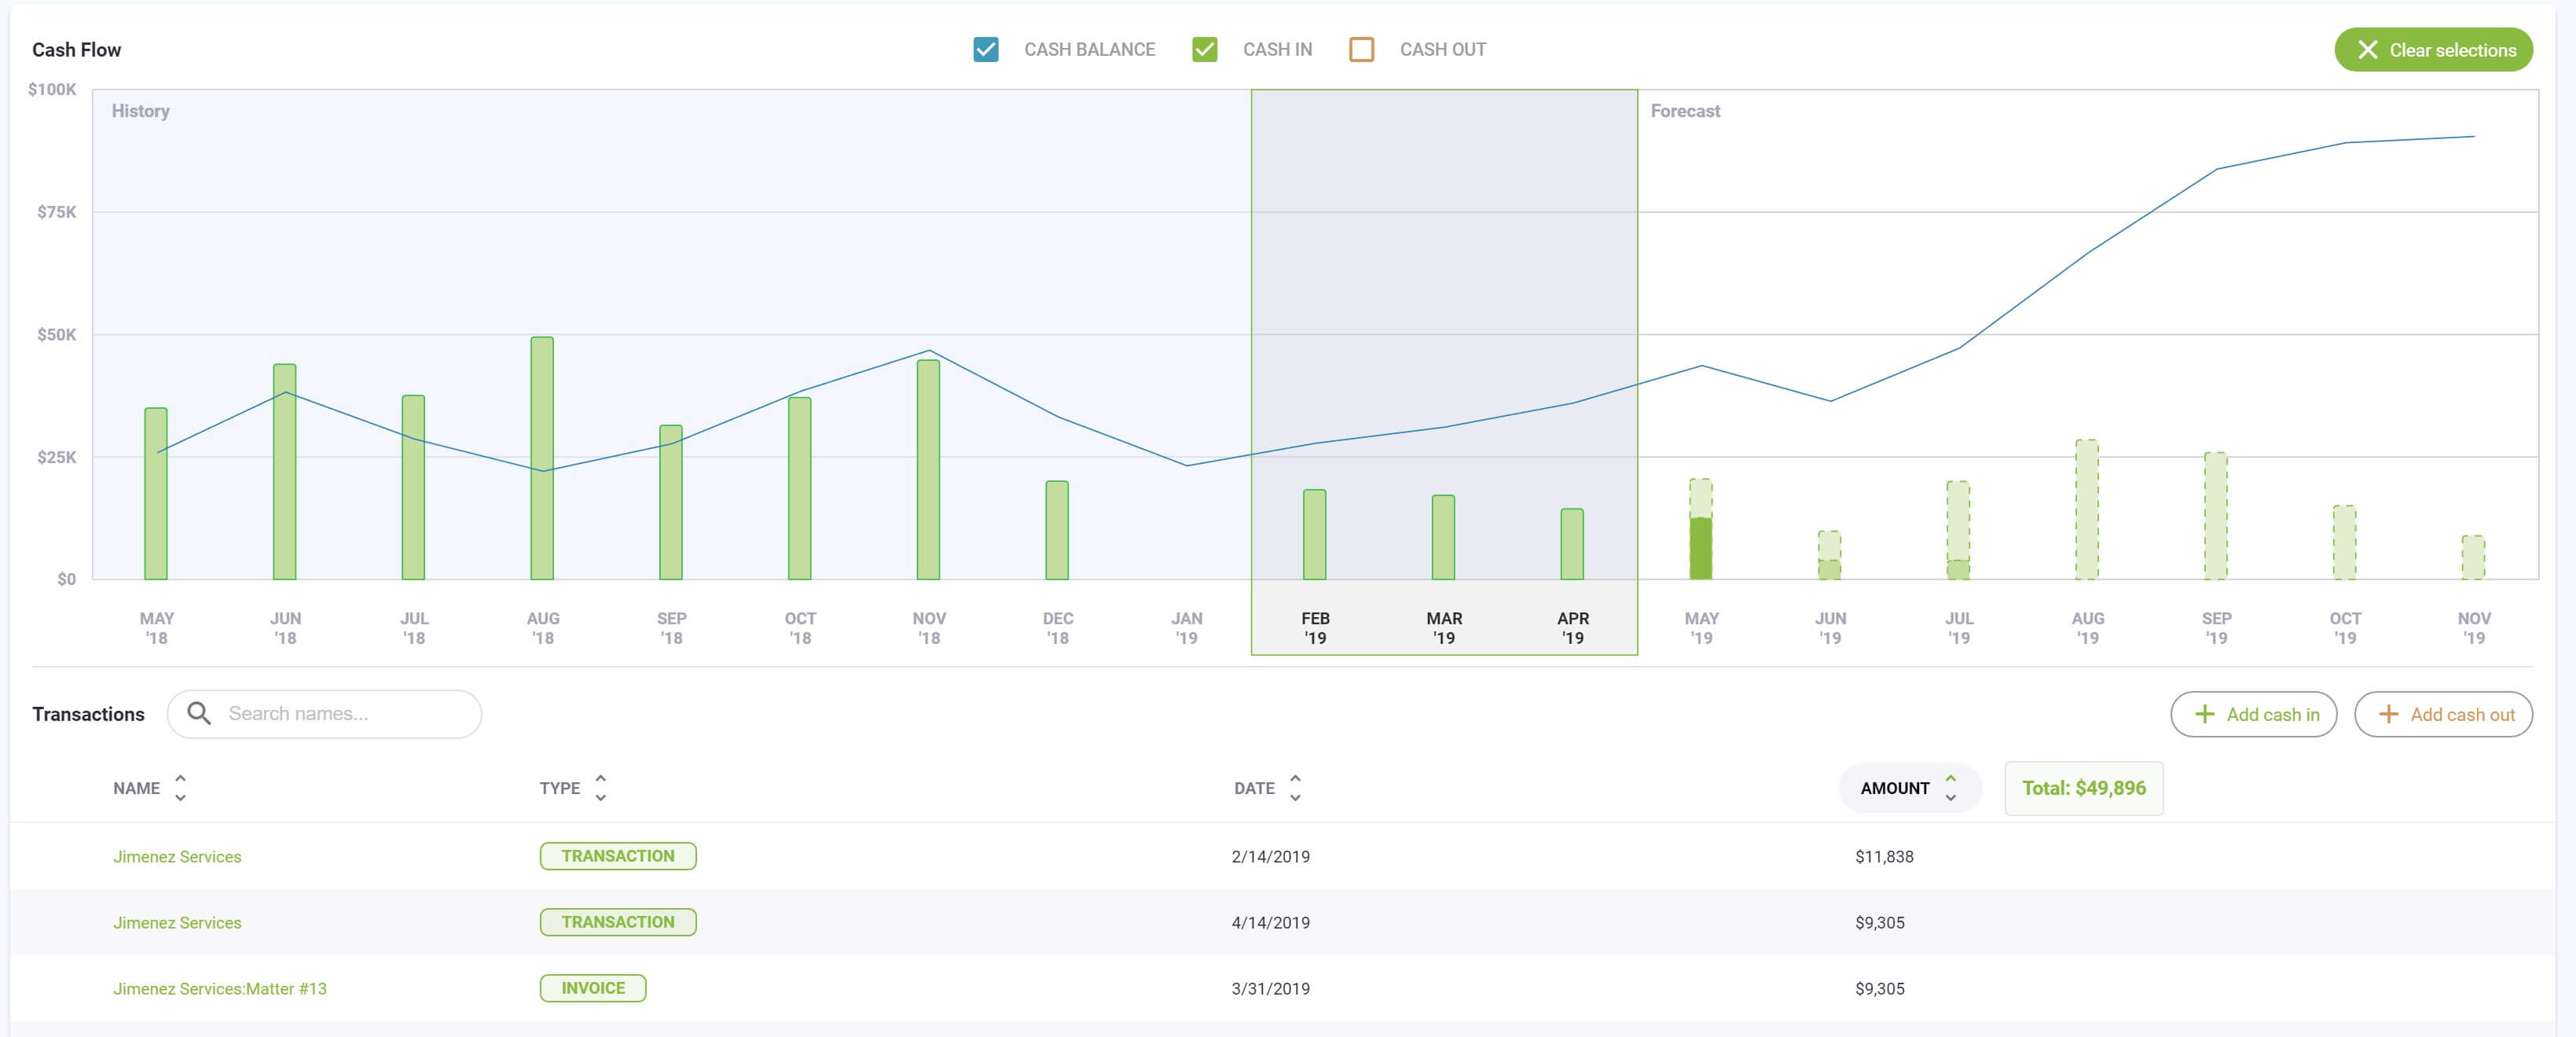
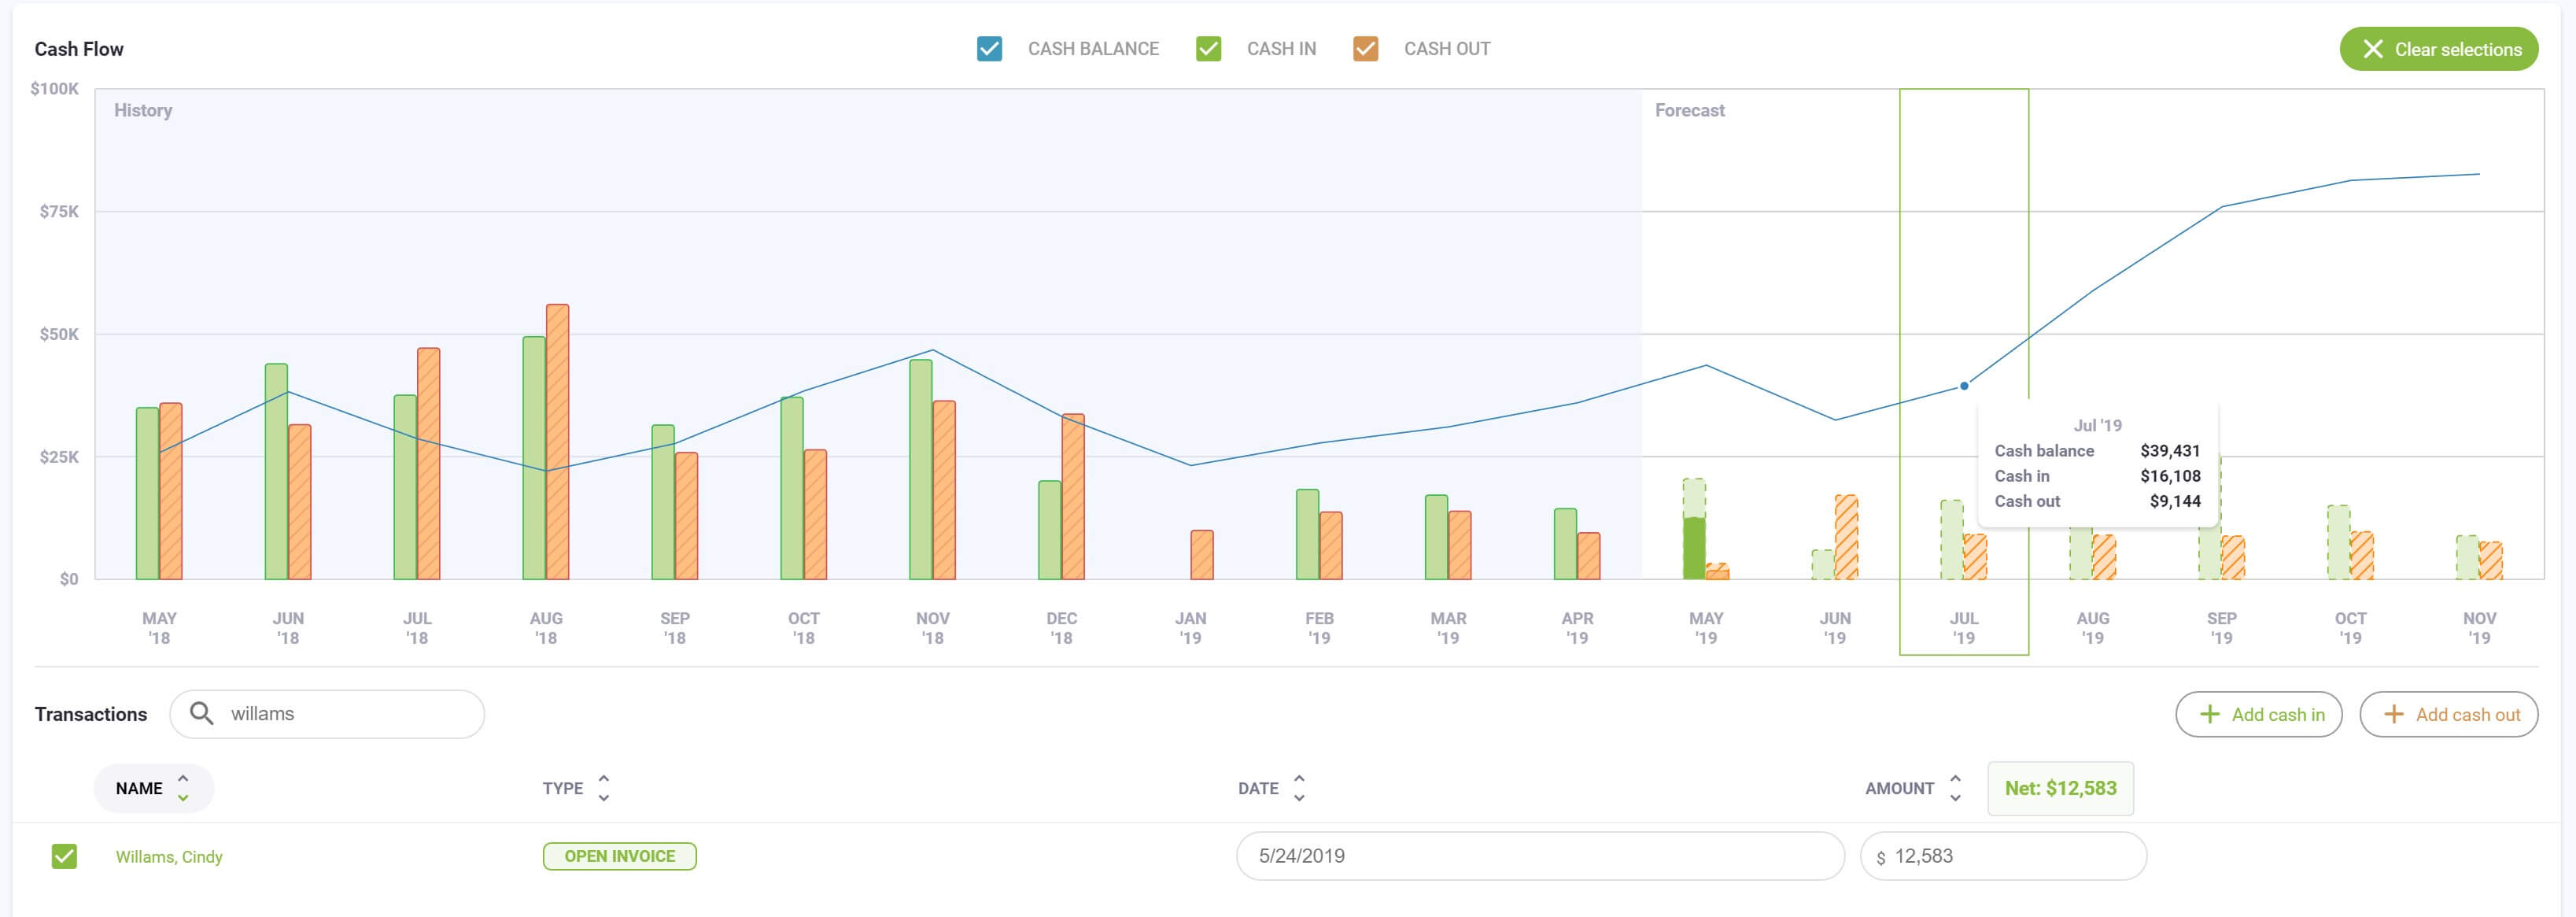
CashFlowTool’s interactive chart gives you the ability to select one or more months directly on the chart and see a total of your net cash plus all of the specific transactions for the selected months. Use the chart to view transactions for one or more months by simply selecting the month on the chart and select multiple months by togging individual months on and off.
Explore common scenarios
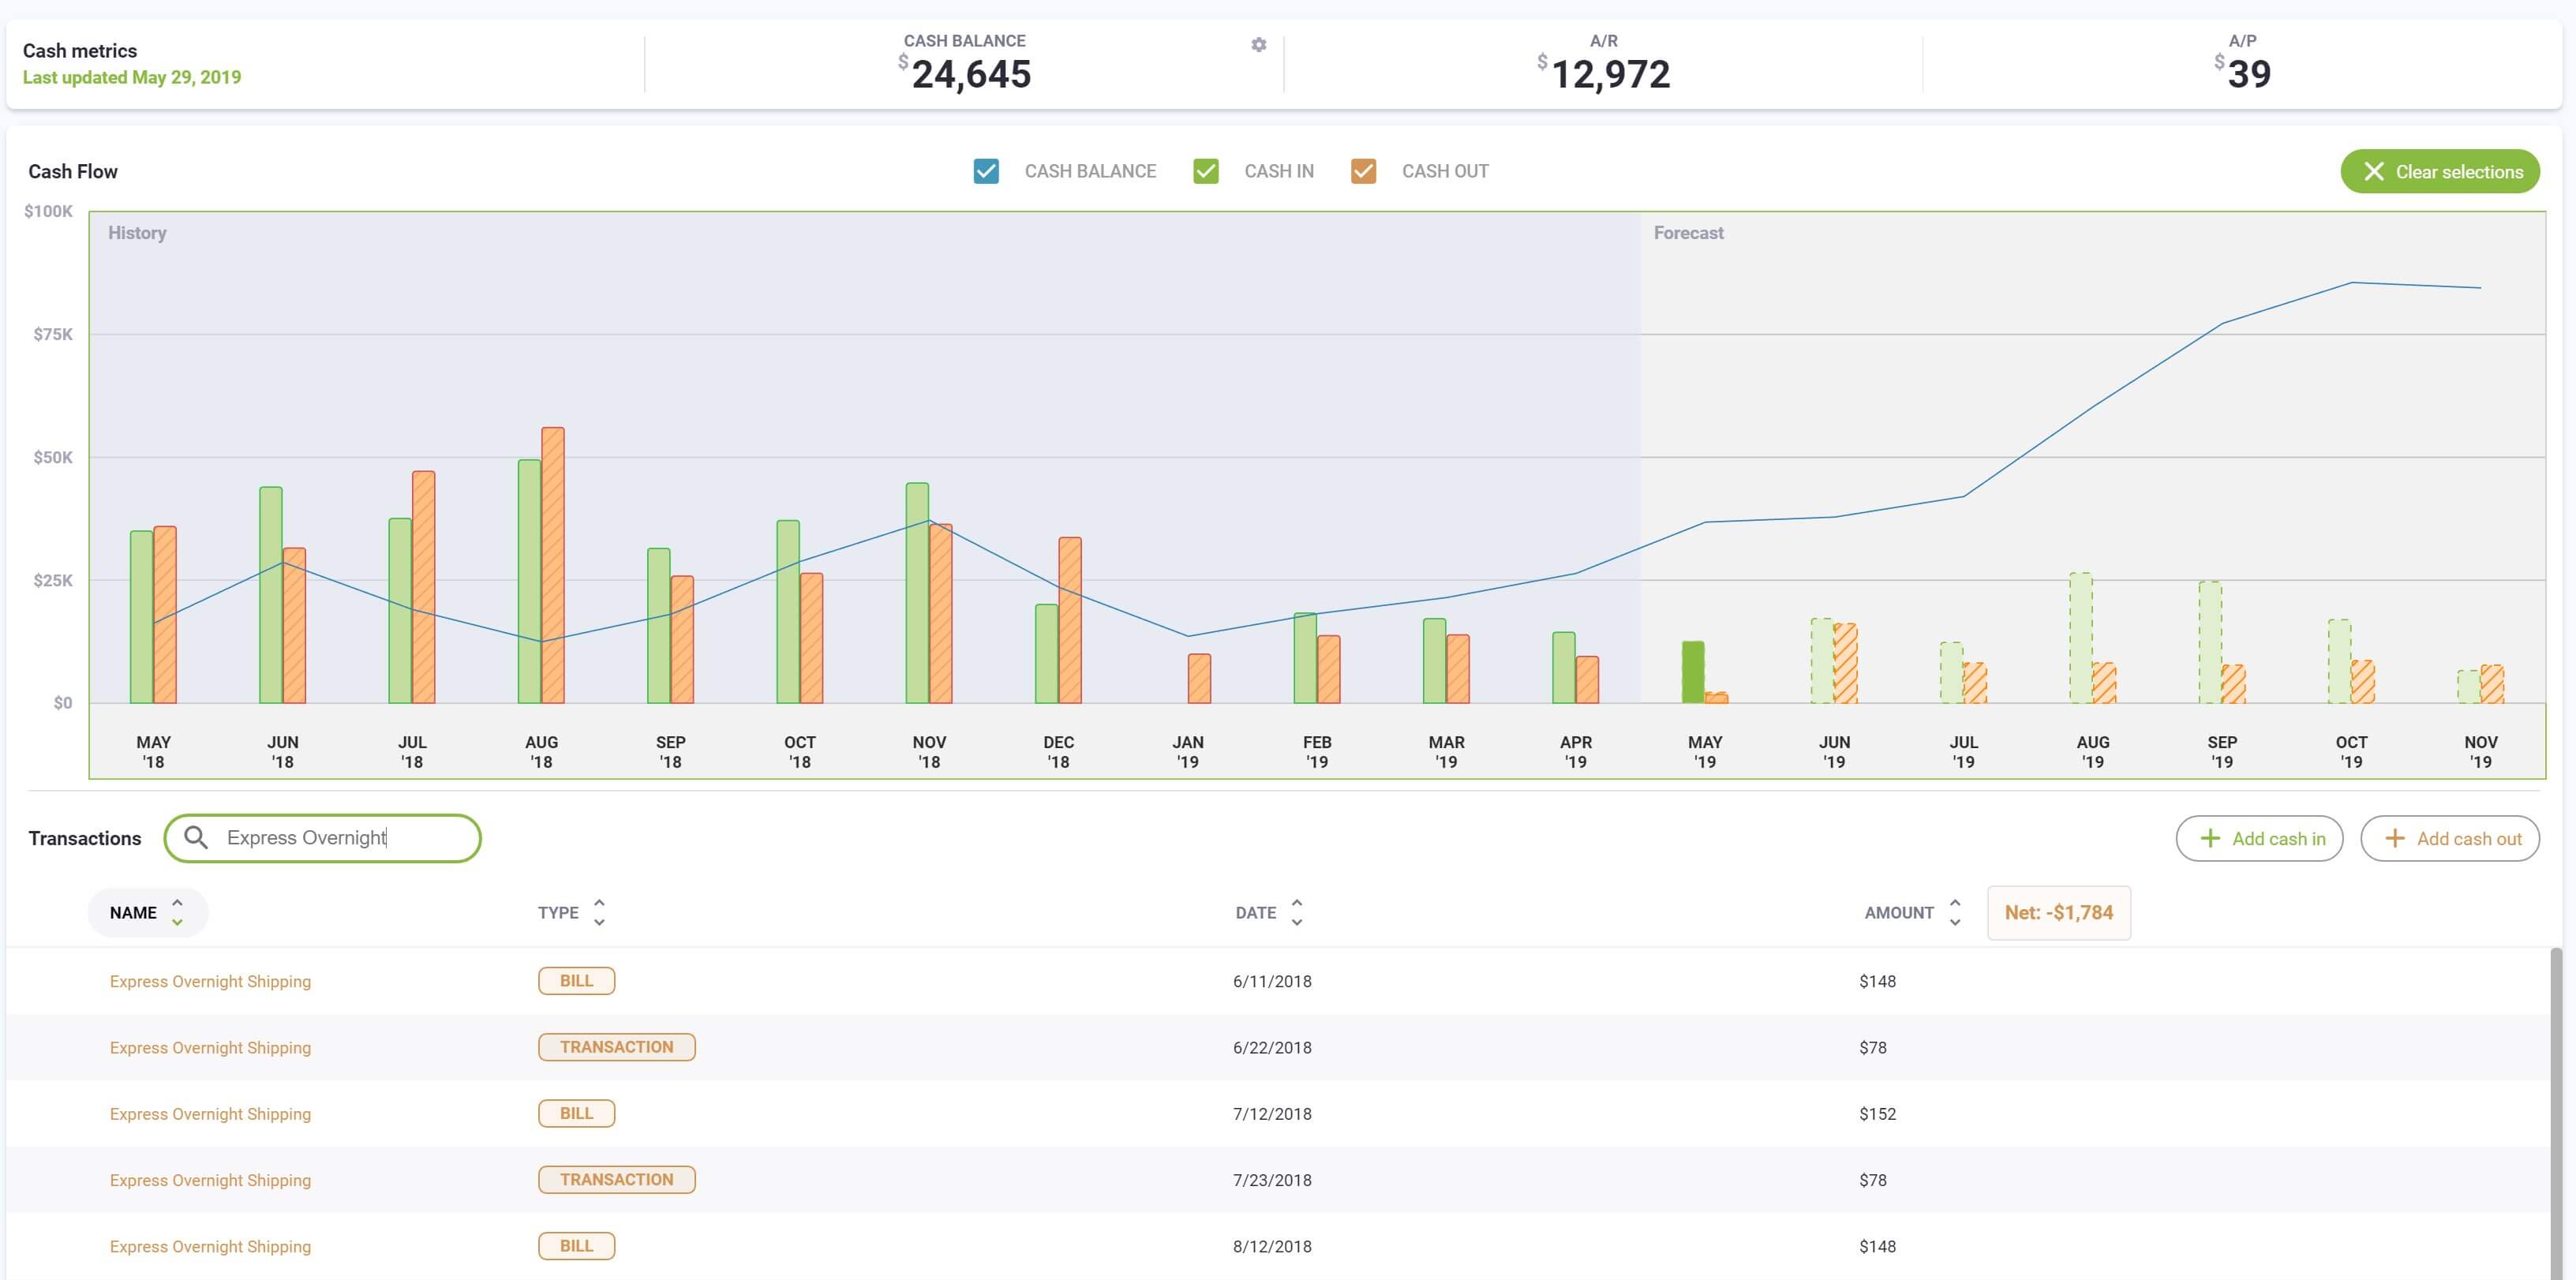
See total transaction amount for a specific customer or vendor
Using the search box, search for a specific customer or vendor. Select specific time periods in the graph to see total amount for the customer or vendor for the selected period.
See largest transaction for a specific time period
Unselect Cash out, select specific time periods in the graph and select to sort the table by amount. The largest cash in transactions will be shown first.
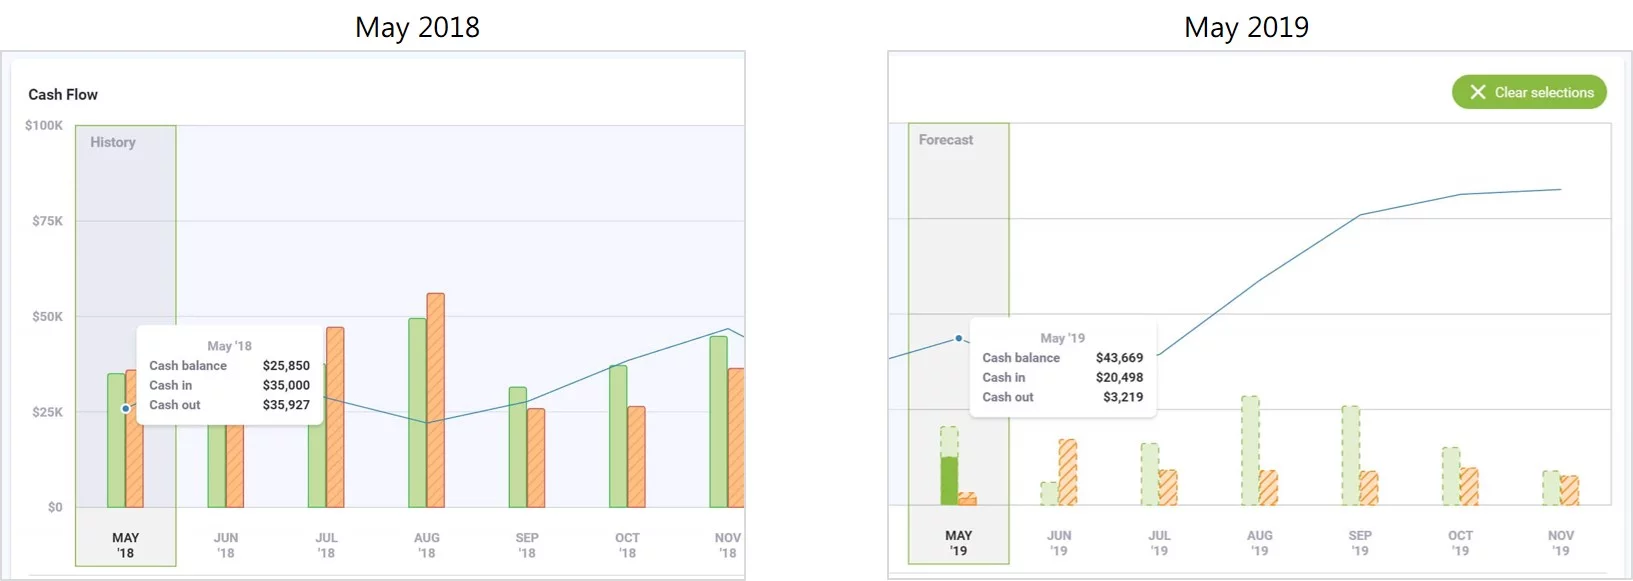
Compare total sales and expense for same period last year
Select the first time period in the chart and note the total shown. Select the second time period and compare the total shown.
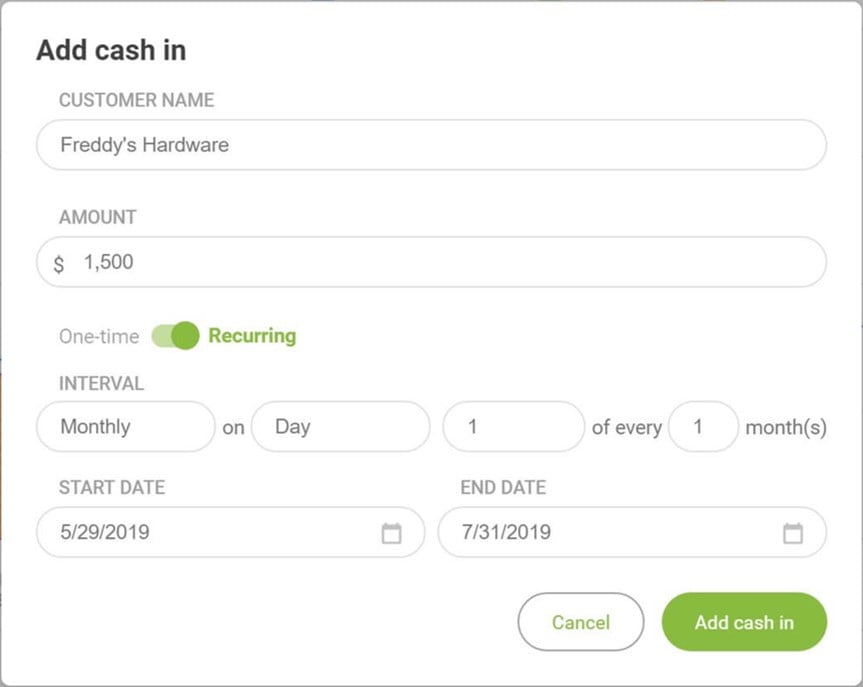
See impact of adding a new customer or vendor
Select Add Cash In and create a new recurring transaction. New recurring transactions will be added to and the forecast immediately updated.
.jpg)
See impact of losing a customer or vendor
Uncheck one or more transactions to exclude from the cash flow forecast. Compare the before an after amounts by hovering over future months.
.jpg)
See projected cash balance for any time period
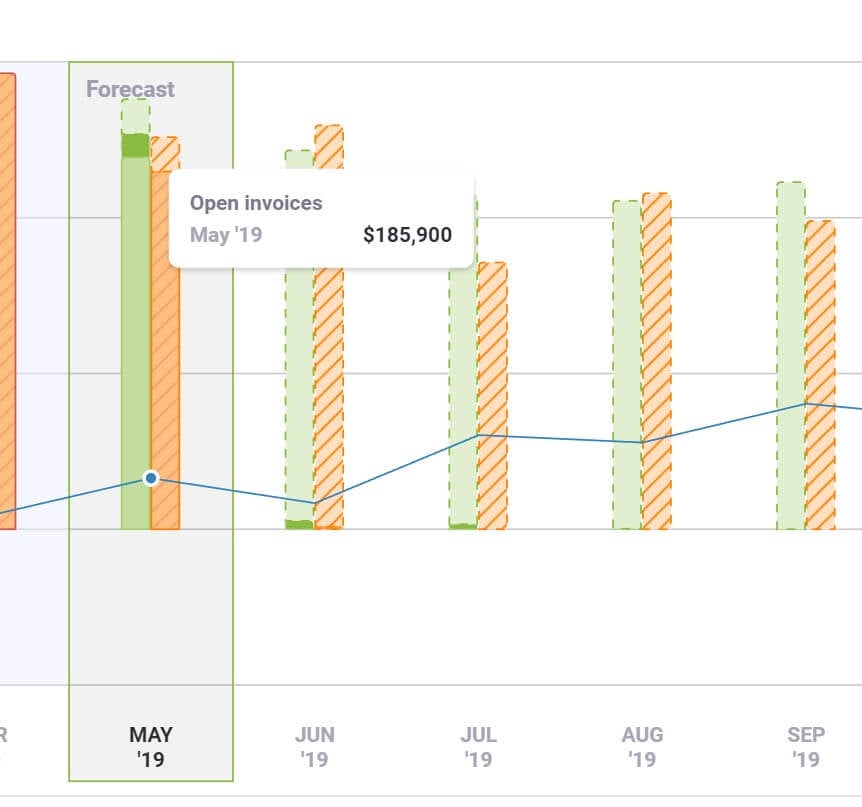
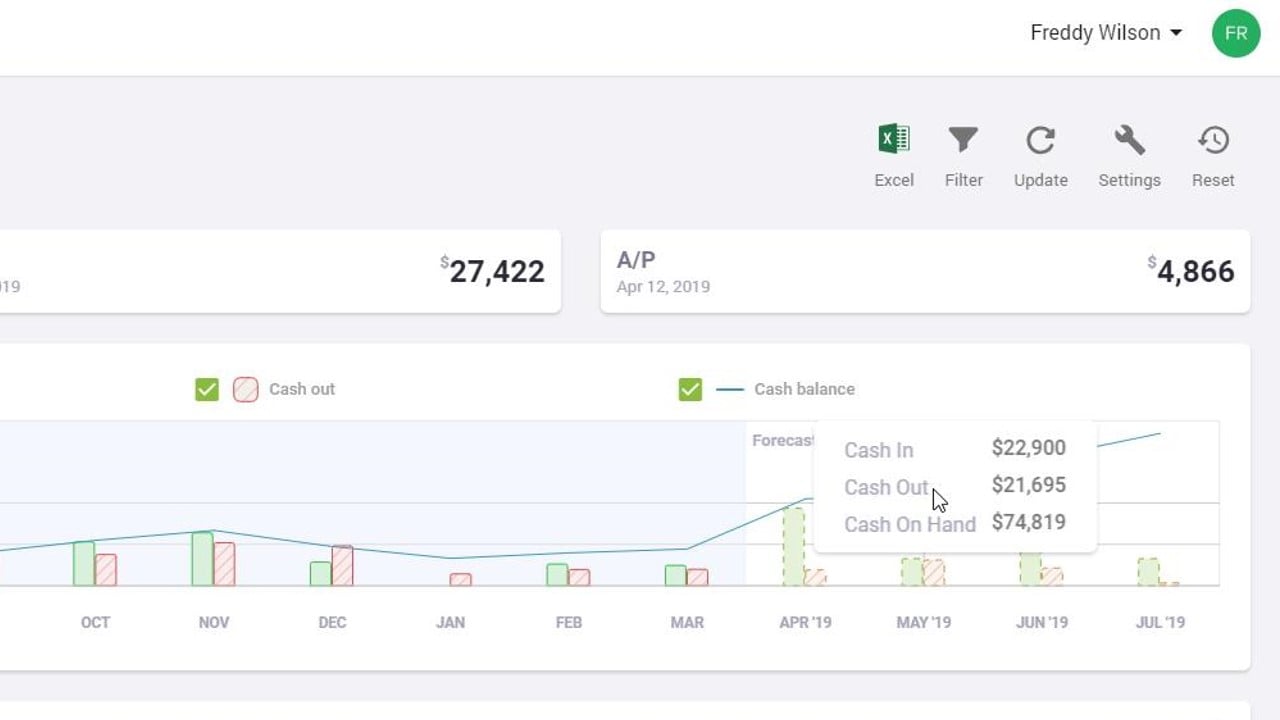
Hover over any chart segment to view forecasted transaction, open invoice and cash-in or cash-out amounts.
Always know your cash flow each month
The interactive chart now shows a breakdown of your cash-in and cash-out by open invoices, forecasted transactions and manually added transactions. By hovering over the chart, you can see exactly what is being forecasted.
.png)
Interactively see what impacts your forecast
See live updates to the chart forecast when you make changes to the cash in or cash out transactions so you can make better decisions today about your future.