We went back to the drawing board and came up with a completely reimagined way to view your future cash flow forecast. It lets you visualize your future forecast in ways you never imagined. Once you see it, you will never want to go back to static forecasting again.
The CashFlowTool team is pleased to announce a major update to CashFlowTool with the introduction of the all-new visual interactive chart. The chart sets a new standard for the way a business can see your forecast as the chart is fully interactive to help you visually see your future. We first updated the chart to now show a full six months into the future. Then we added the ability to hover and discover things on the chart such as hovering over a future month and quickly seeing the selected month's forecast. We didn't stop there as we wanted to provide full interactivity. Want to see multiple future months? Just select the months you want to see and instantly you will see the forecast. Want to compare a future month to the same month a year ago? Easy. Want to see the cash out for a particular month in the future? Simple. Watch the video below to see a demo and read more in this blog to discover the full power of the visual interactive chart. We can't wait for you to try it!
Fully interactive chart
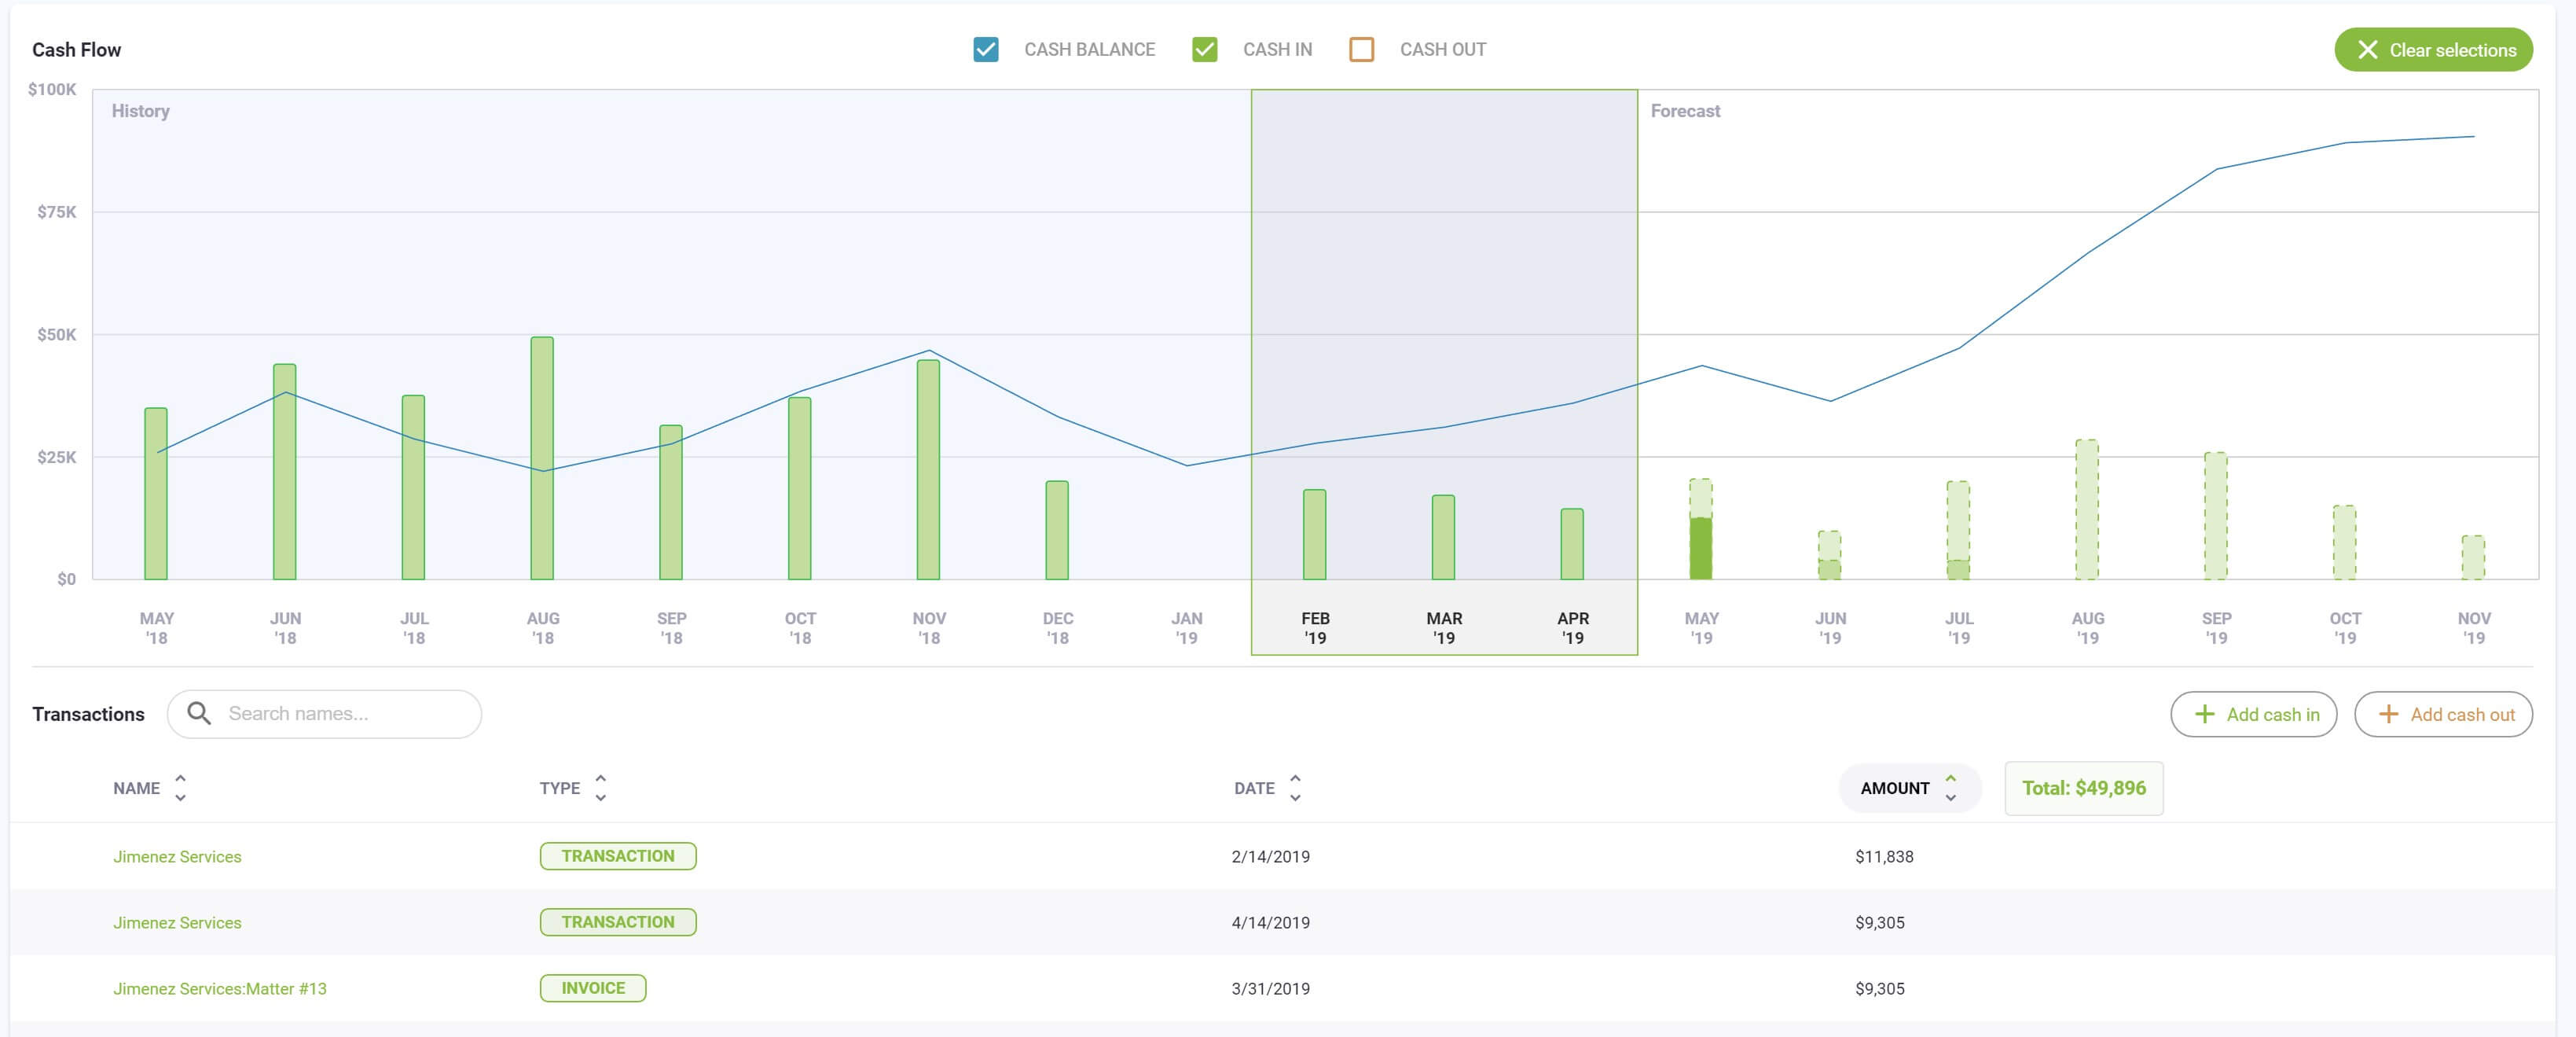
CashFlowTool’s interactive charts gives you the ability to select one or more months directly on the chart and see a total of your net cash plus all of the specific transactions for the selected months. Use the chart to view transactions for one or more months by simply selecting the month on the chart and select multiple months by togging individual months on and off.
You can also select to show just cash-in or cash-out transactions by unchecking cash-in or cash-out on the chart. To show just cash in transactions, uncheck cash out from the chart.
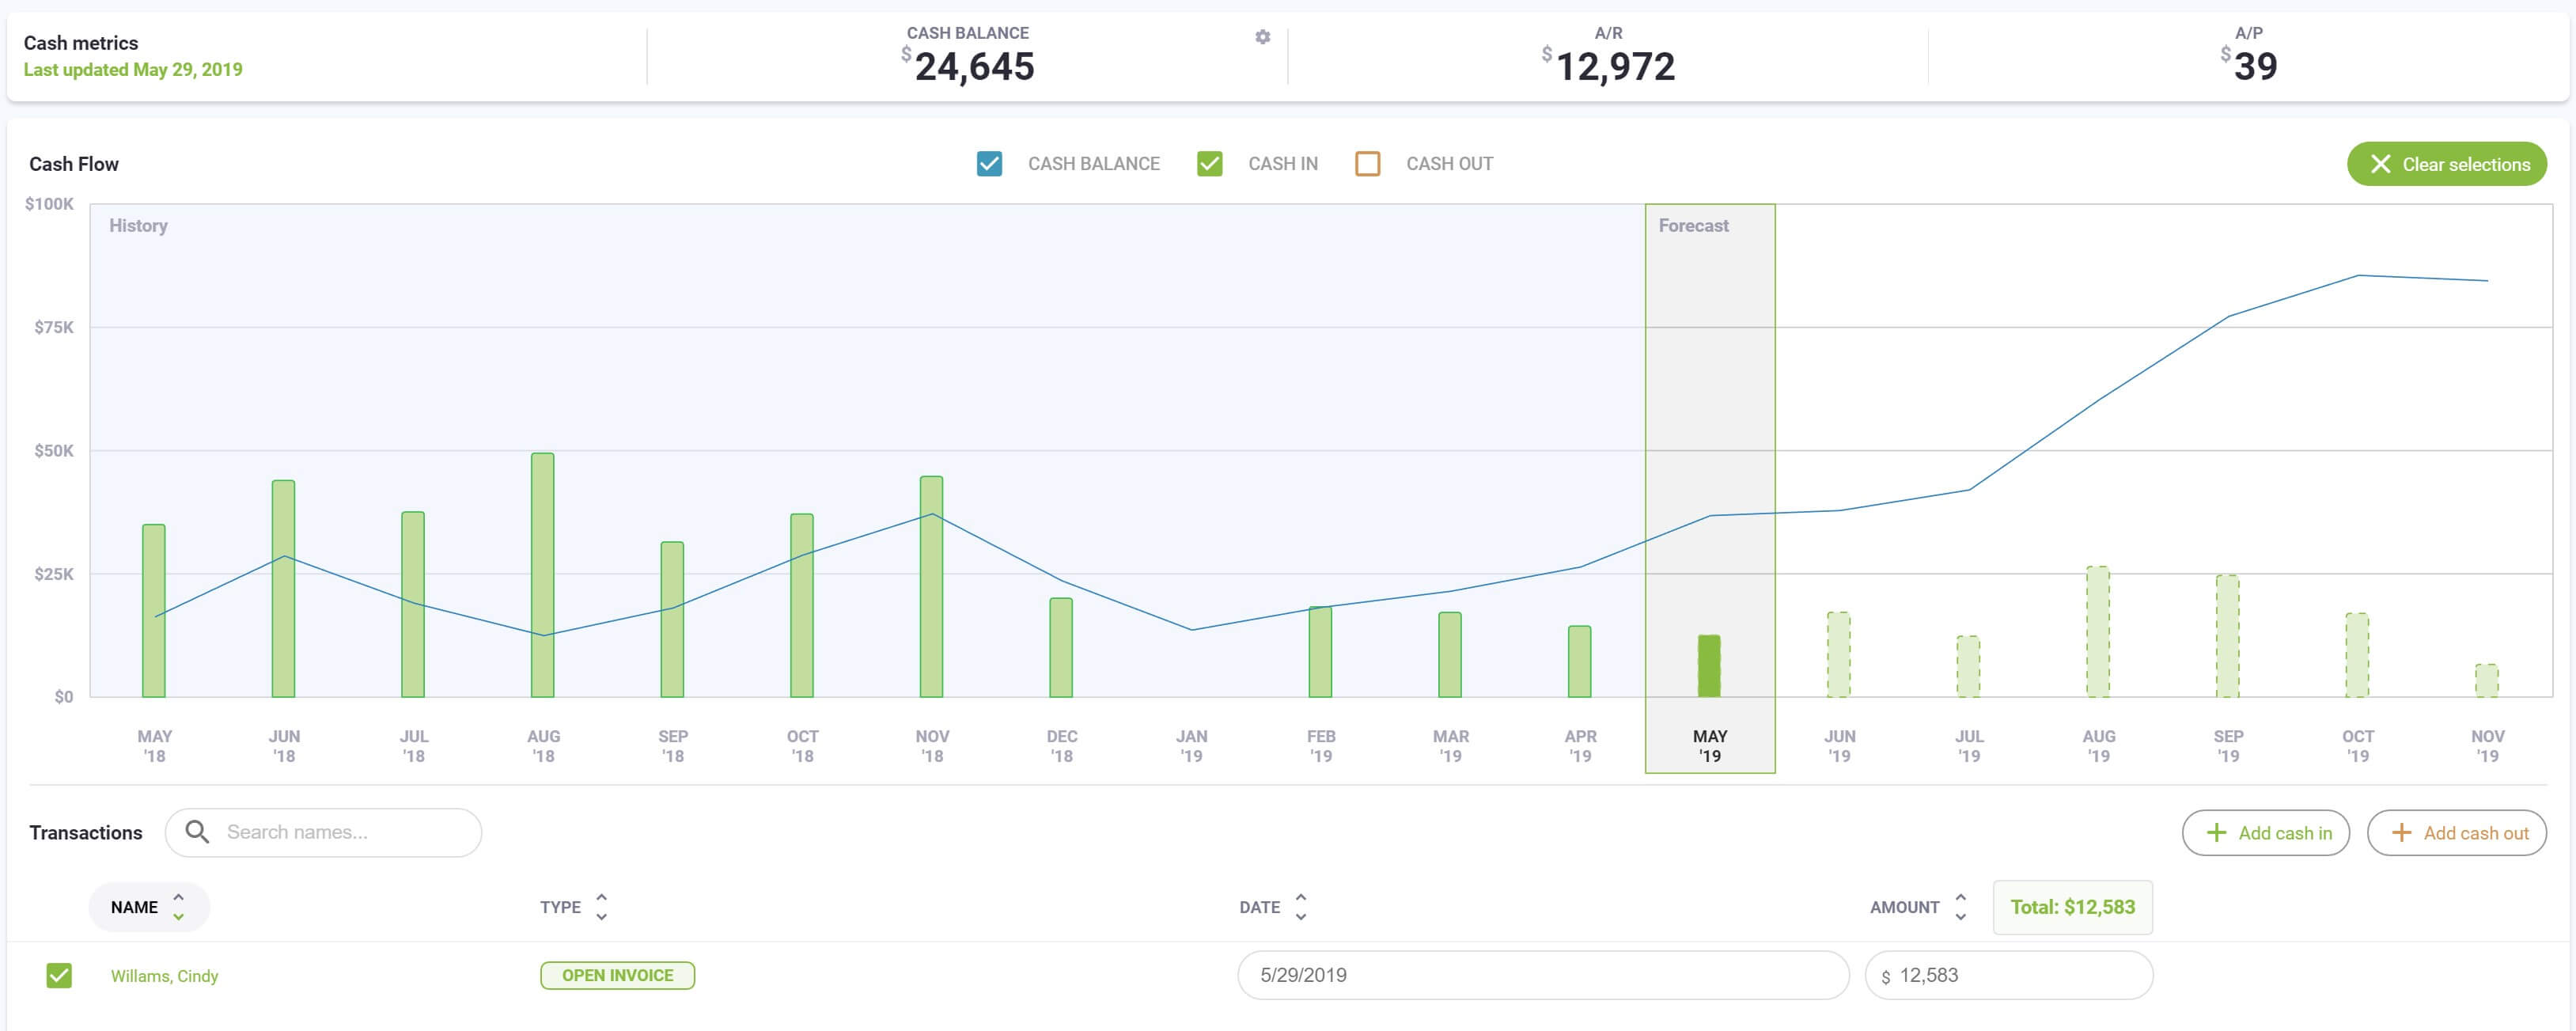
By default, the chart shows transactions for the next 6 months. When you select one or more months, just the transactions for the months selected are shown. Pressing the ‘Clear sections’ button resets to showing just forecasted transactions.
View historical transactions
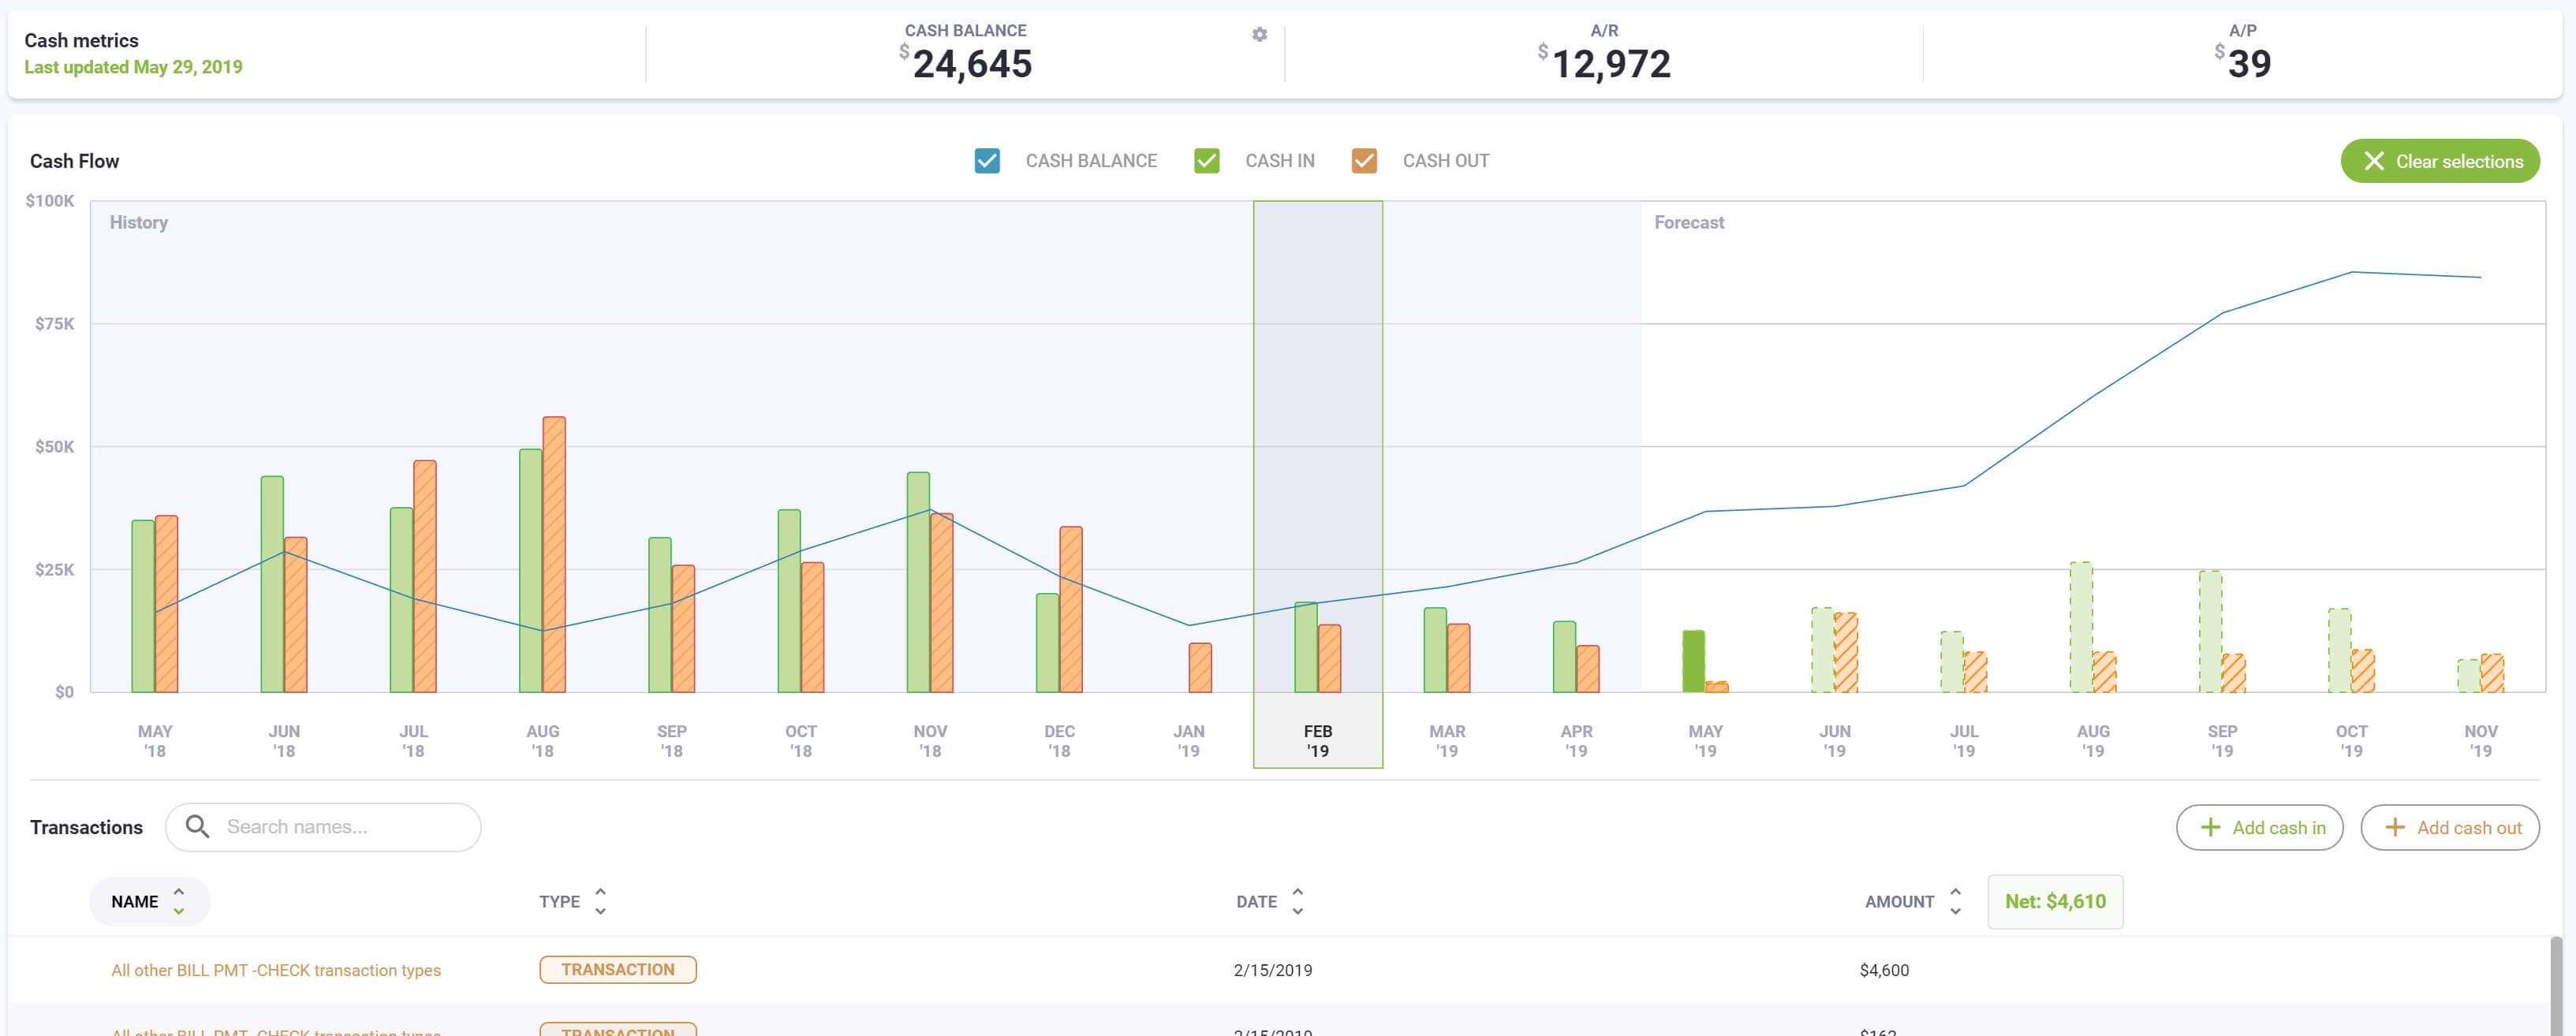
Historical transactions are shown by selecting previous months on the chart. Now you can see your actual cash in and cash out transaction giving you historical context what has happened in the past. Being able to quickly see your historical transactions allows you to make more informed decisions.
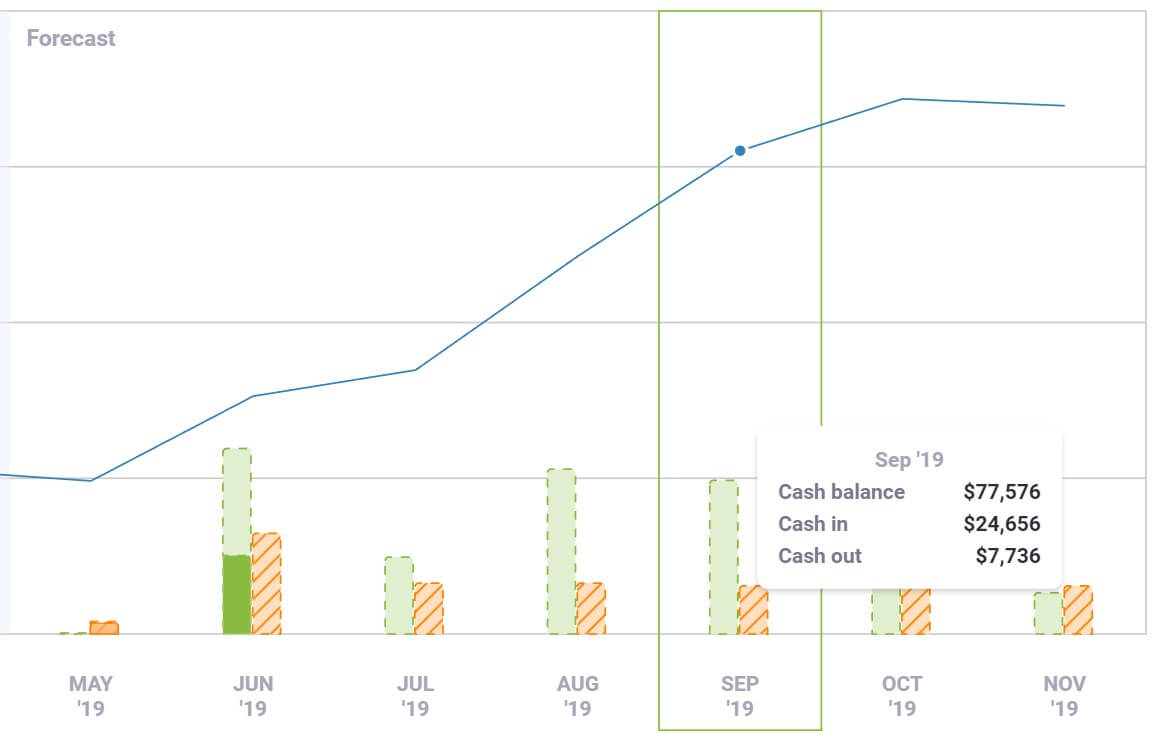
View forecasted transactions
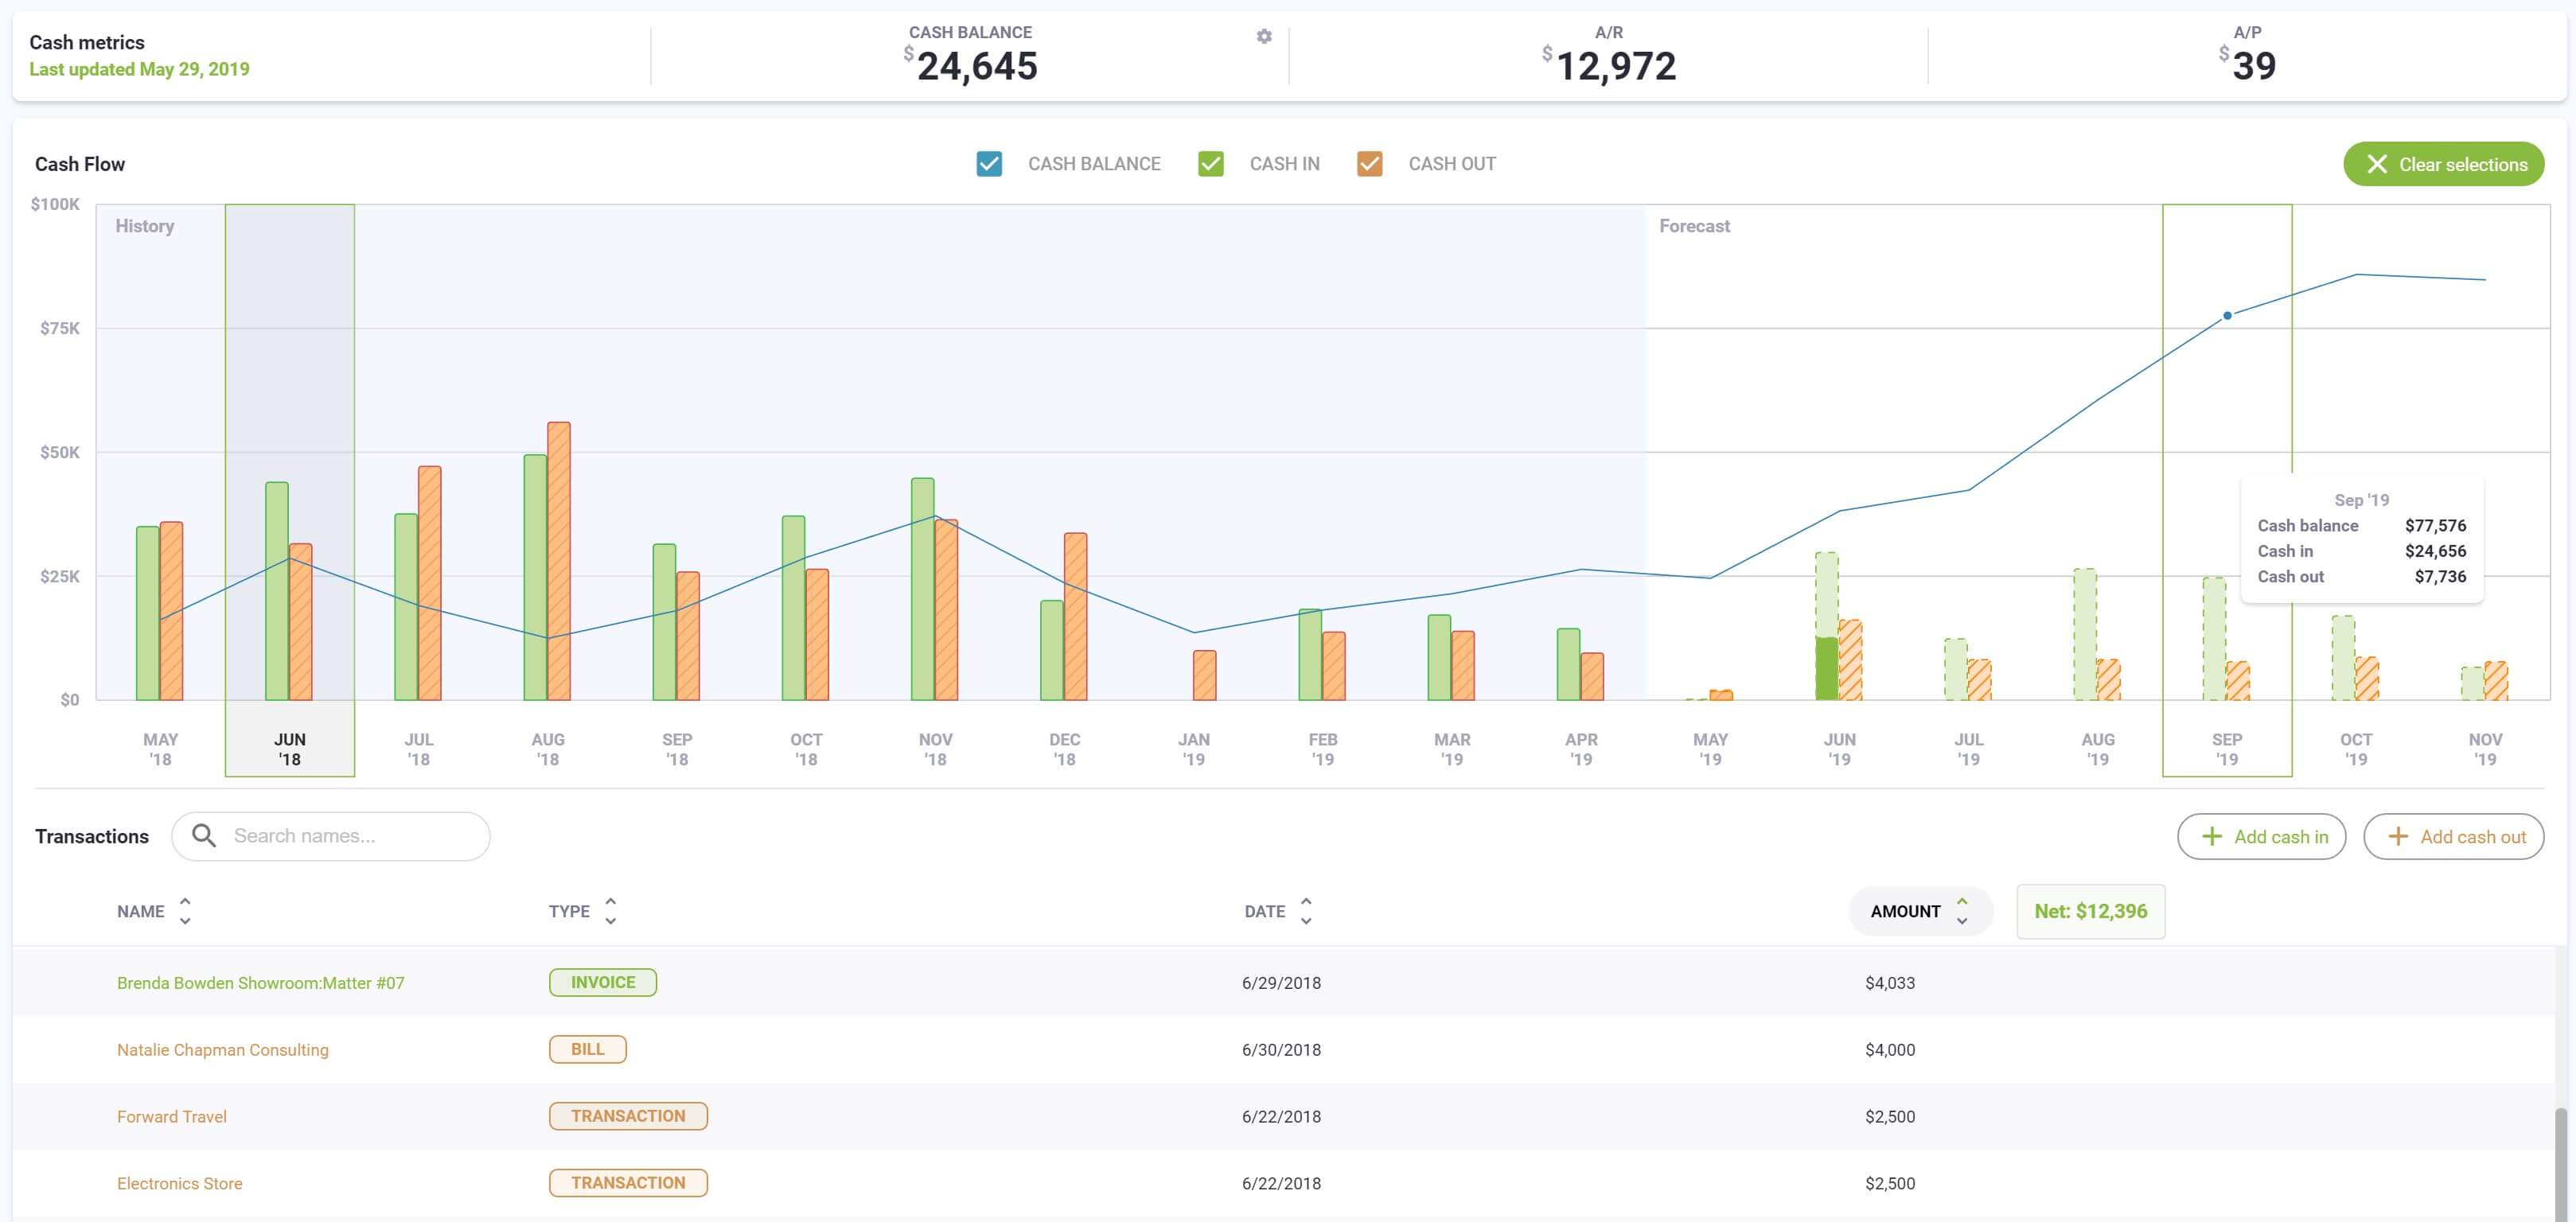
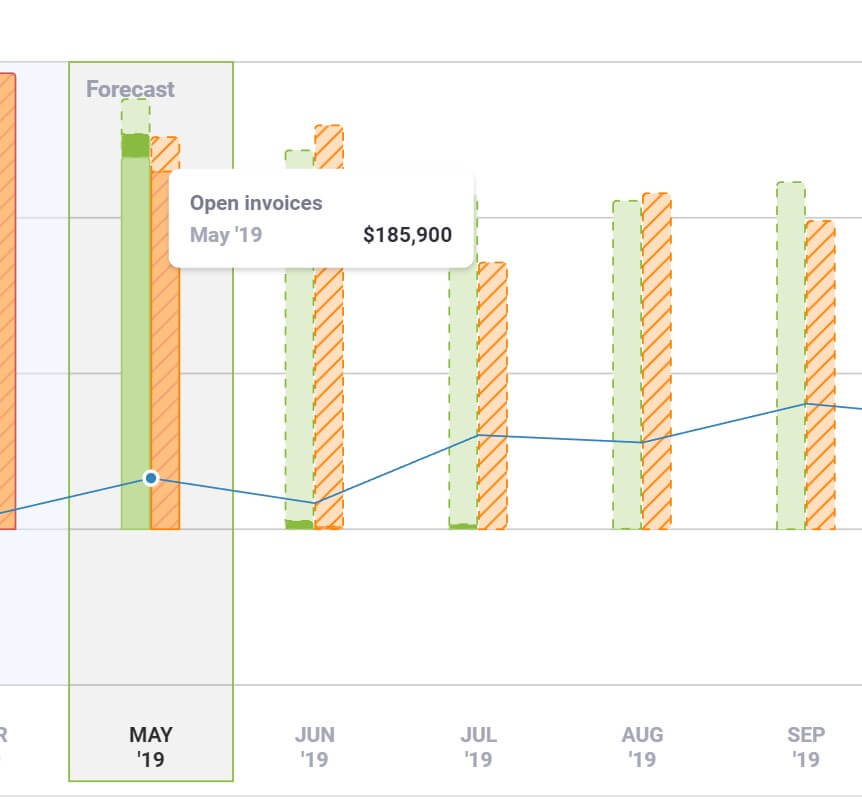
The interactive chart now shows a breakdown of your cash-in and cash-out by open invoices, forecasted transactions and manually added transactions. By hovering over the chart, you can see exactly what is being forecasted.
Customer / Vendor details
Select a customer or vendor from the transaction list to see a detailed view the customer or vendors. The customer and vendors detail screen show a chart of your historical and forecast and a list of all your forecasted transactions. You can quickly see how a customer or vendor is perform and make adjustments to the forecast. Changes saved are instantly reflected in all CashFlowTool views.
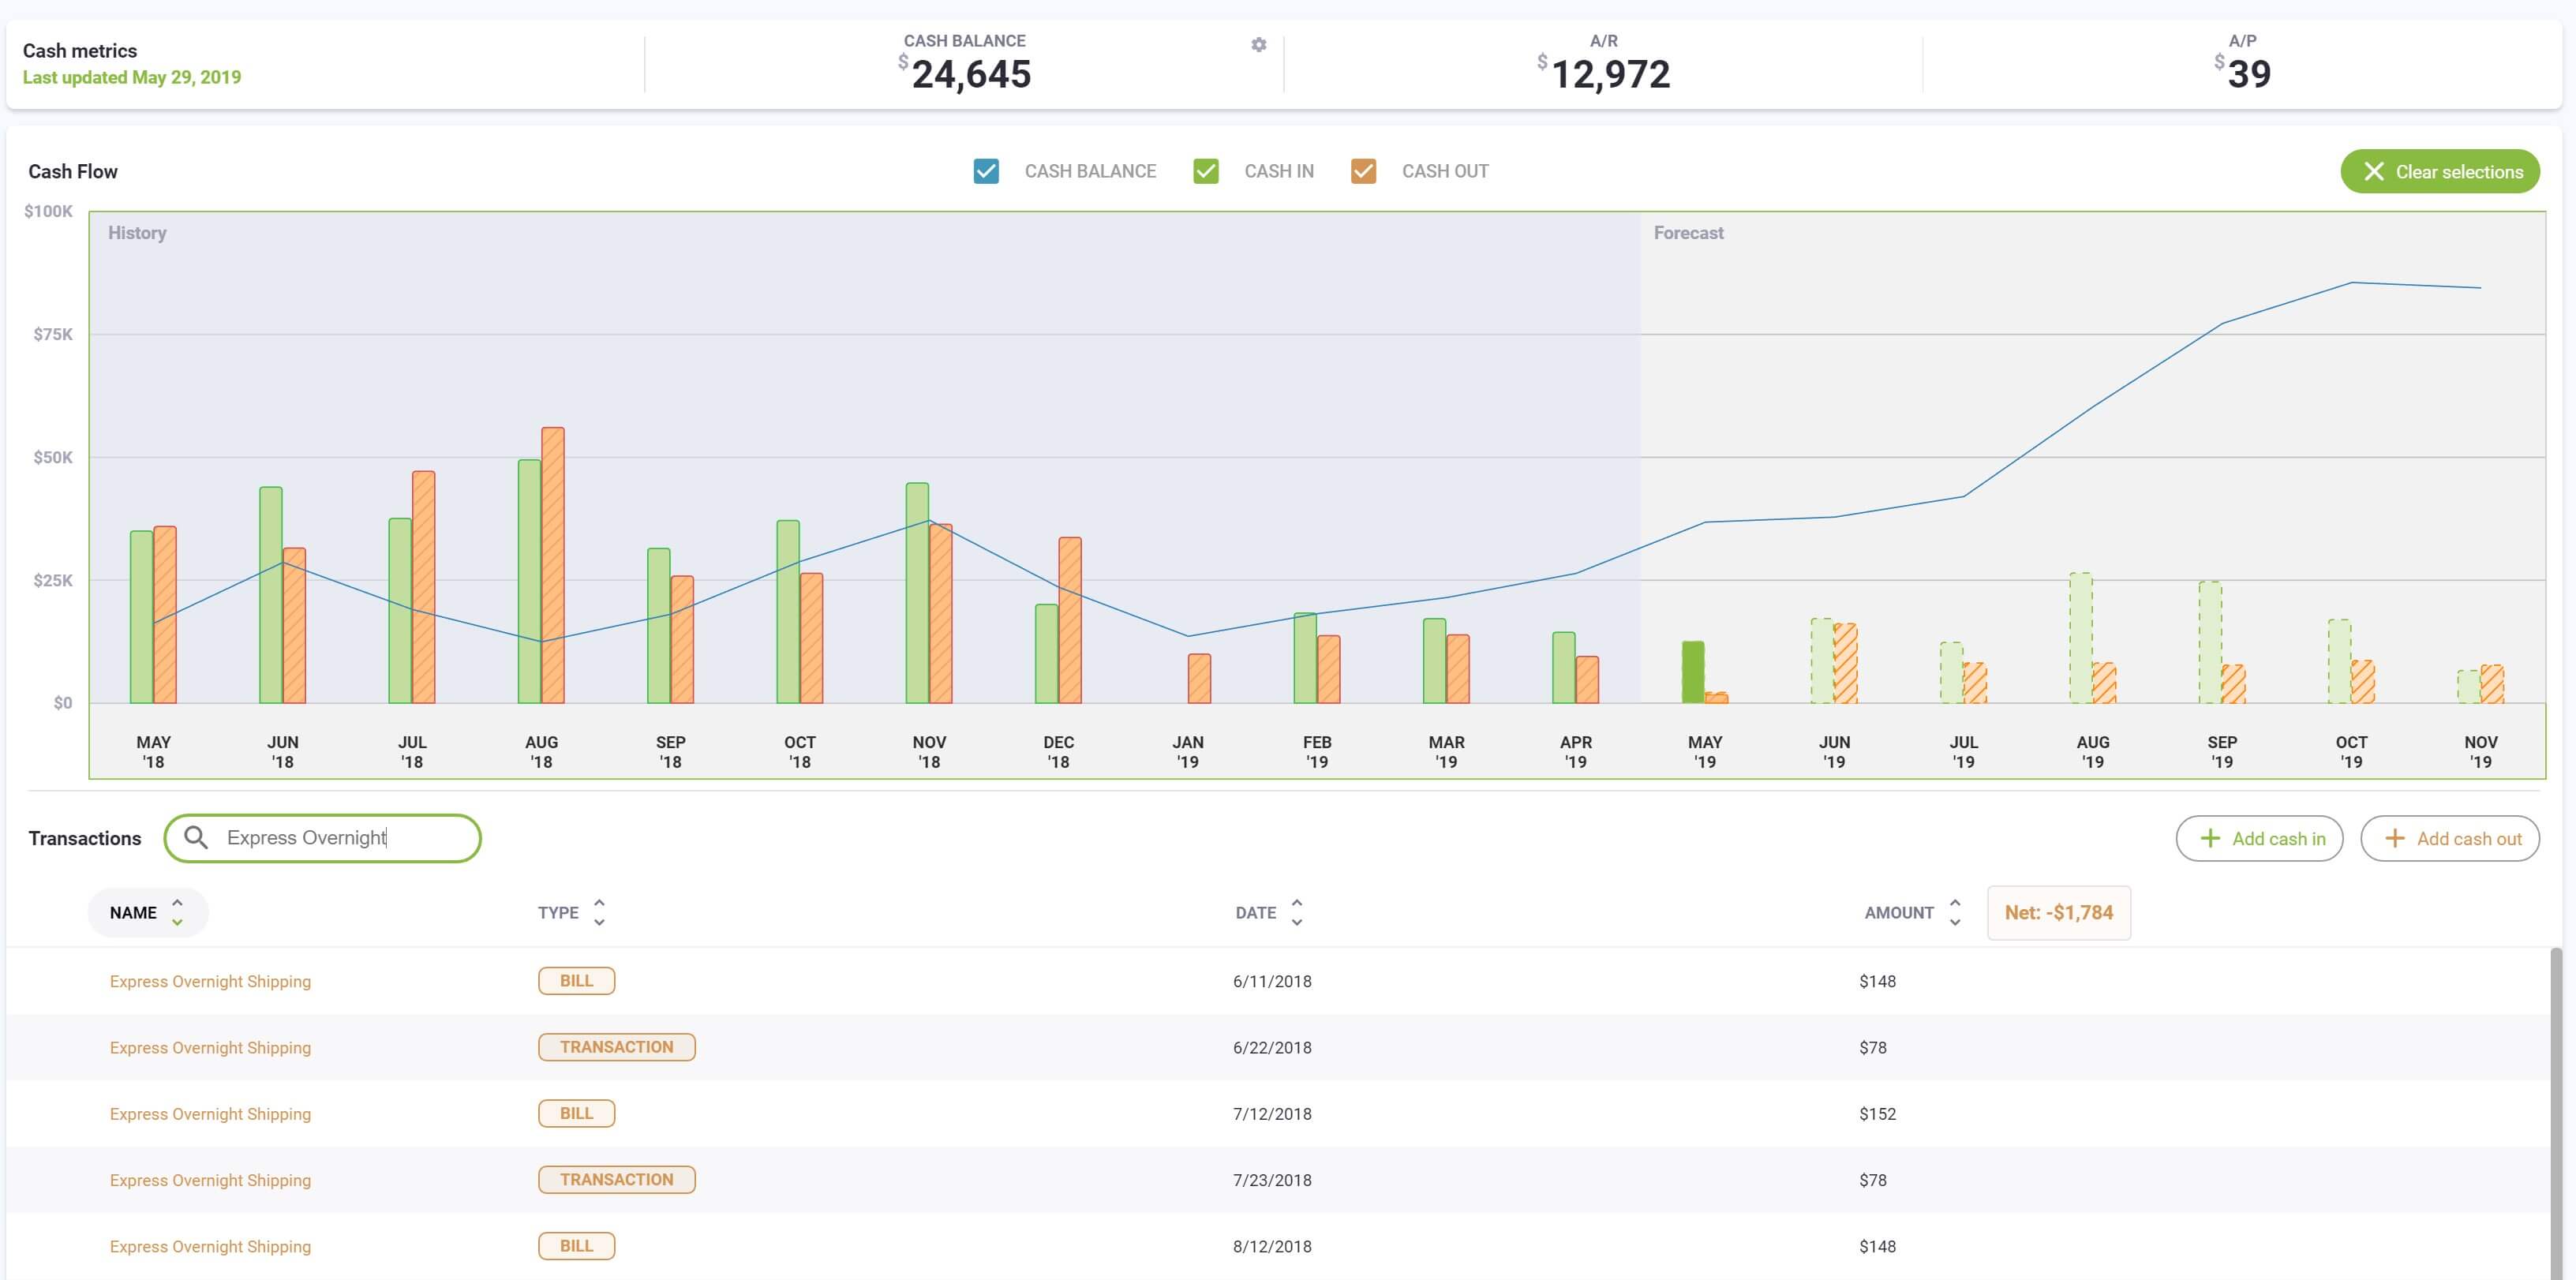
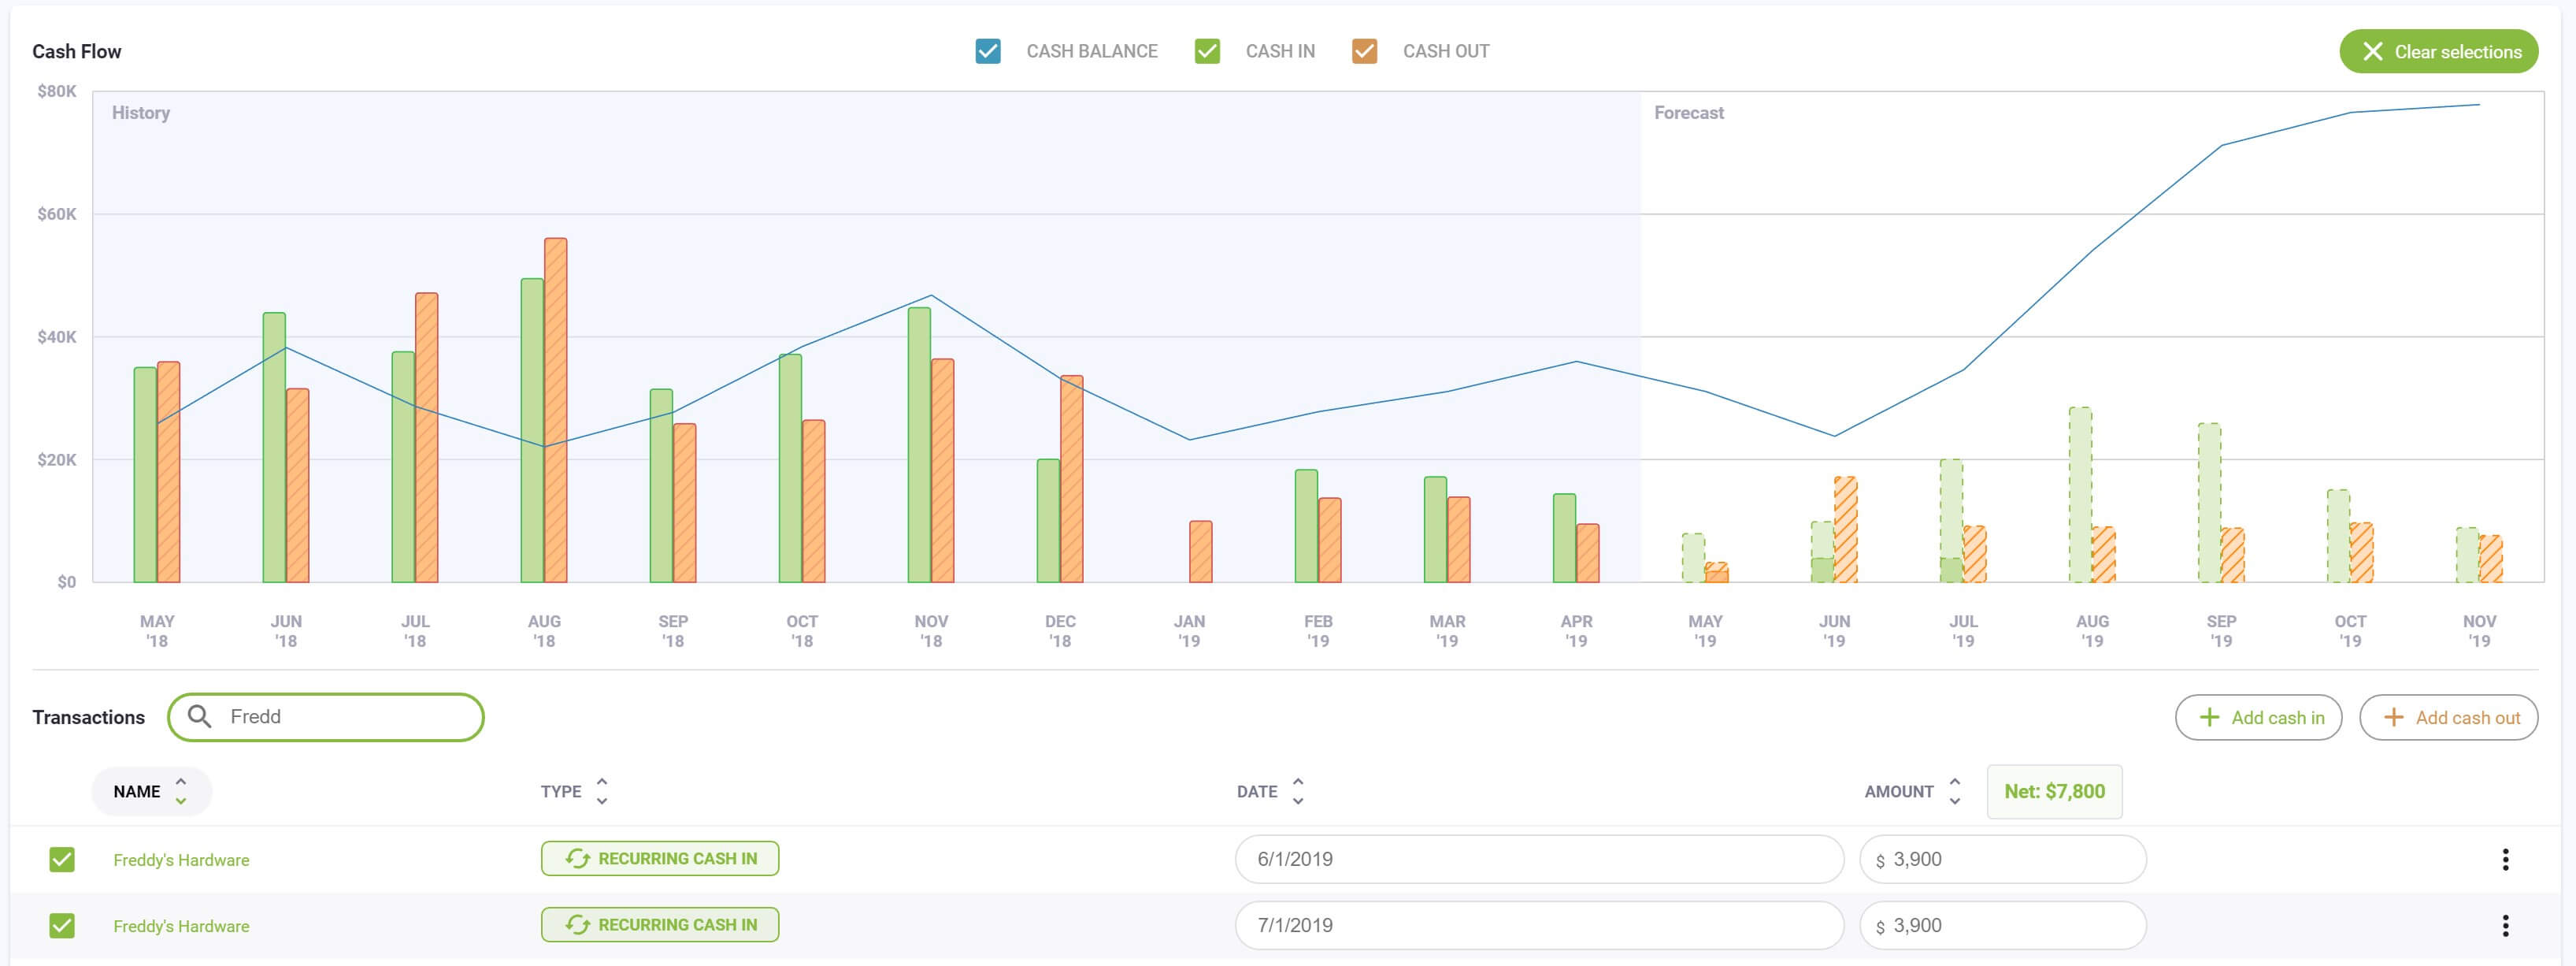
Search
Search has been added to the transaction table allowing you to quickly search and find customers and vendors. As you start typing, the transaction table will be filtered with search results. For example, you can see how much you have spent for a specific vendor by selecting past months and then searching for the vendor name.

Common Scenarios
The following are some examples of common scenarios you can accomplish:
- See total transaction amount for a specific customer or vendor
- See largest transaction for a specific time period
- Compare total sales and expense for same period last year
- See impacting of adding a new customer or vendor
- See impact of loosing a customer or vendor
- See forecasted transactions amount vs. open invoices amount for any time period
- See projected cash balance for any time period
See total transaction amount for a specific customer or vendor
Using the search box, search for a specific customer or vendor. Select specific time periods in the graph to see total amount for the customer or vendor for the selected period.
See largest cash-in transactions for a specific time period
Unselect Cash out, select specific time periods in the graph and select to sort the table by amount. The largest cash in transactions will be shown first.
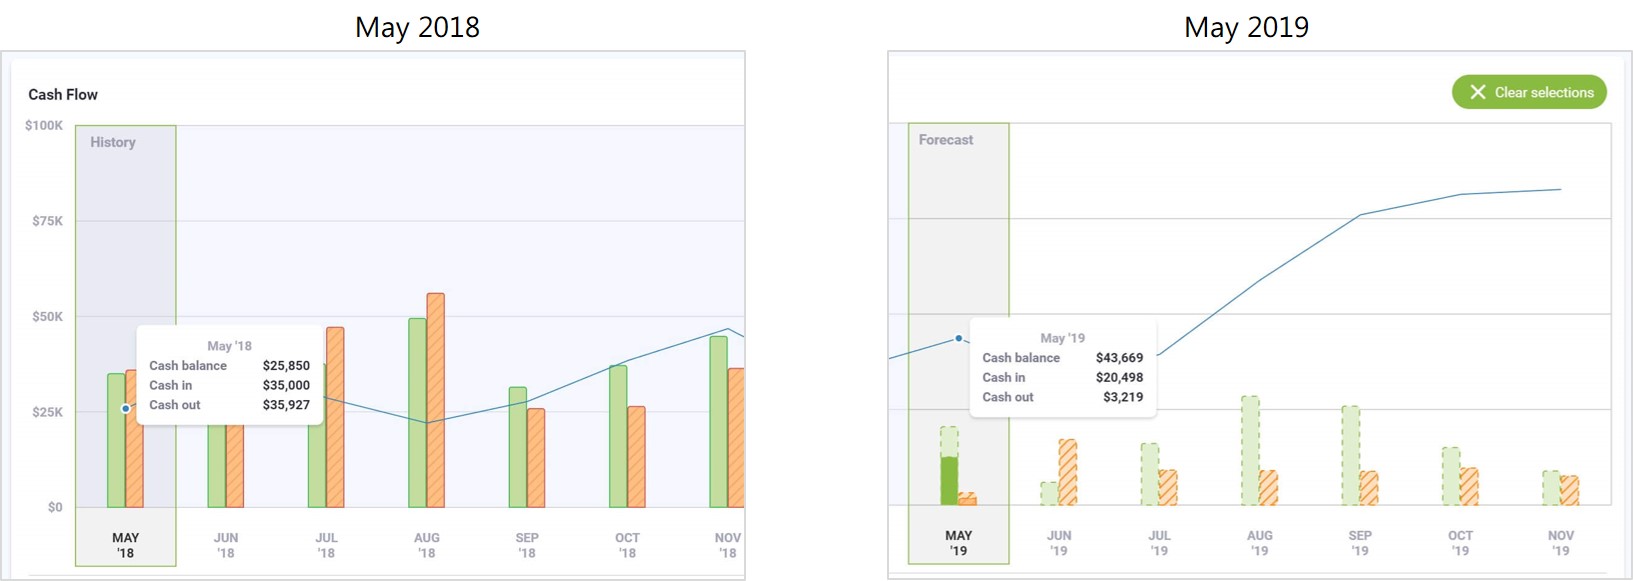
Compare total sales and expense for same period last year
Select the first time period in the chart and note the total shown. Select the second time period and compare the total shown.
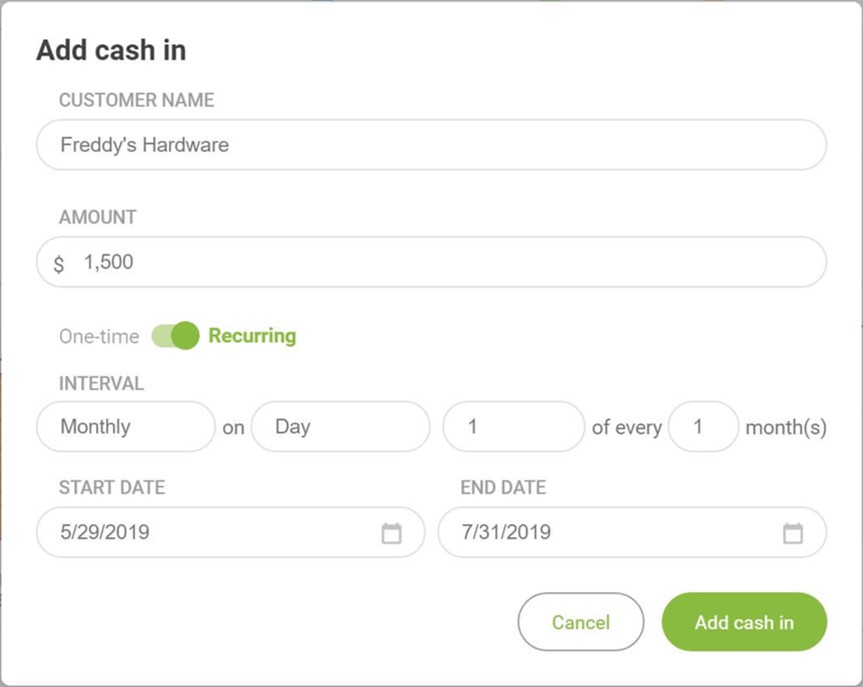
See impacting of adding a new customer
Select Add Cash In and create a new recurring transaction. New recurring transactions will be added to and the forecast immediately updated.
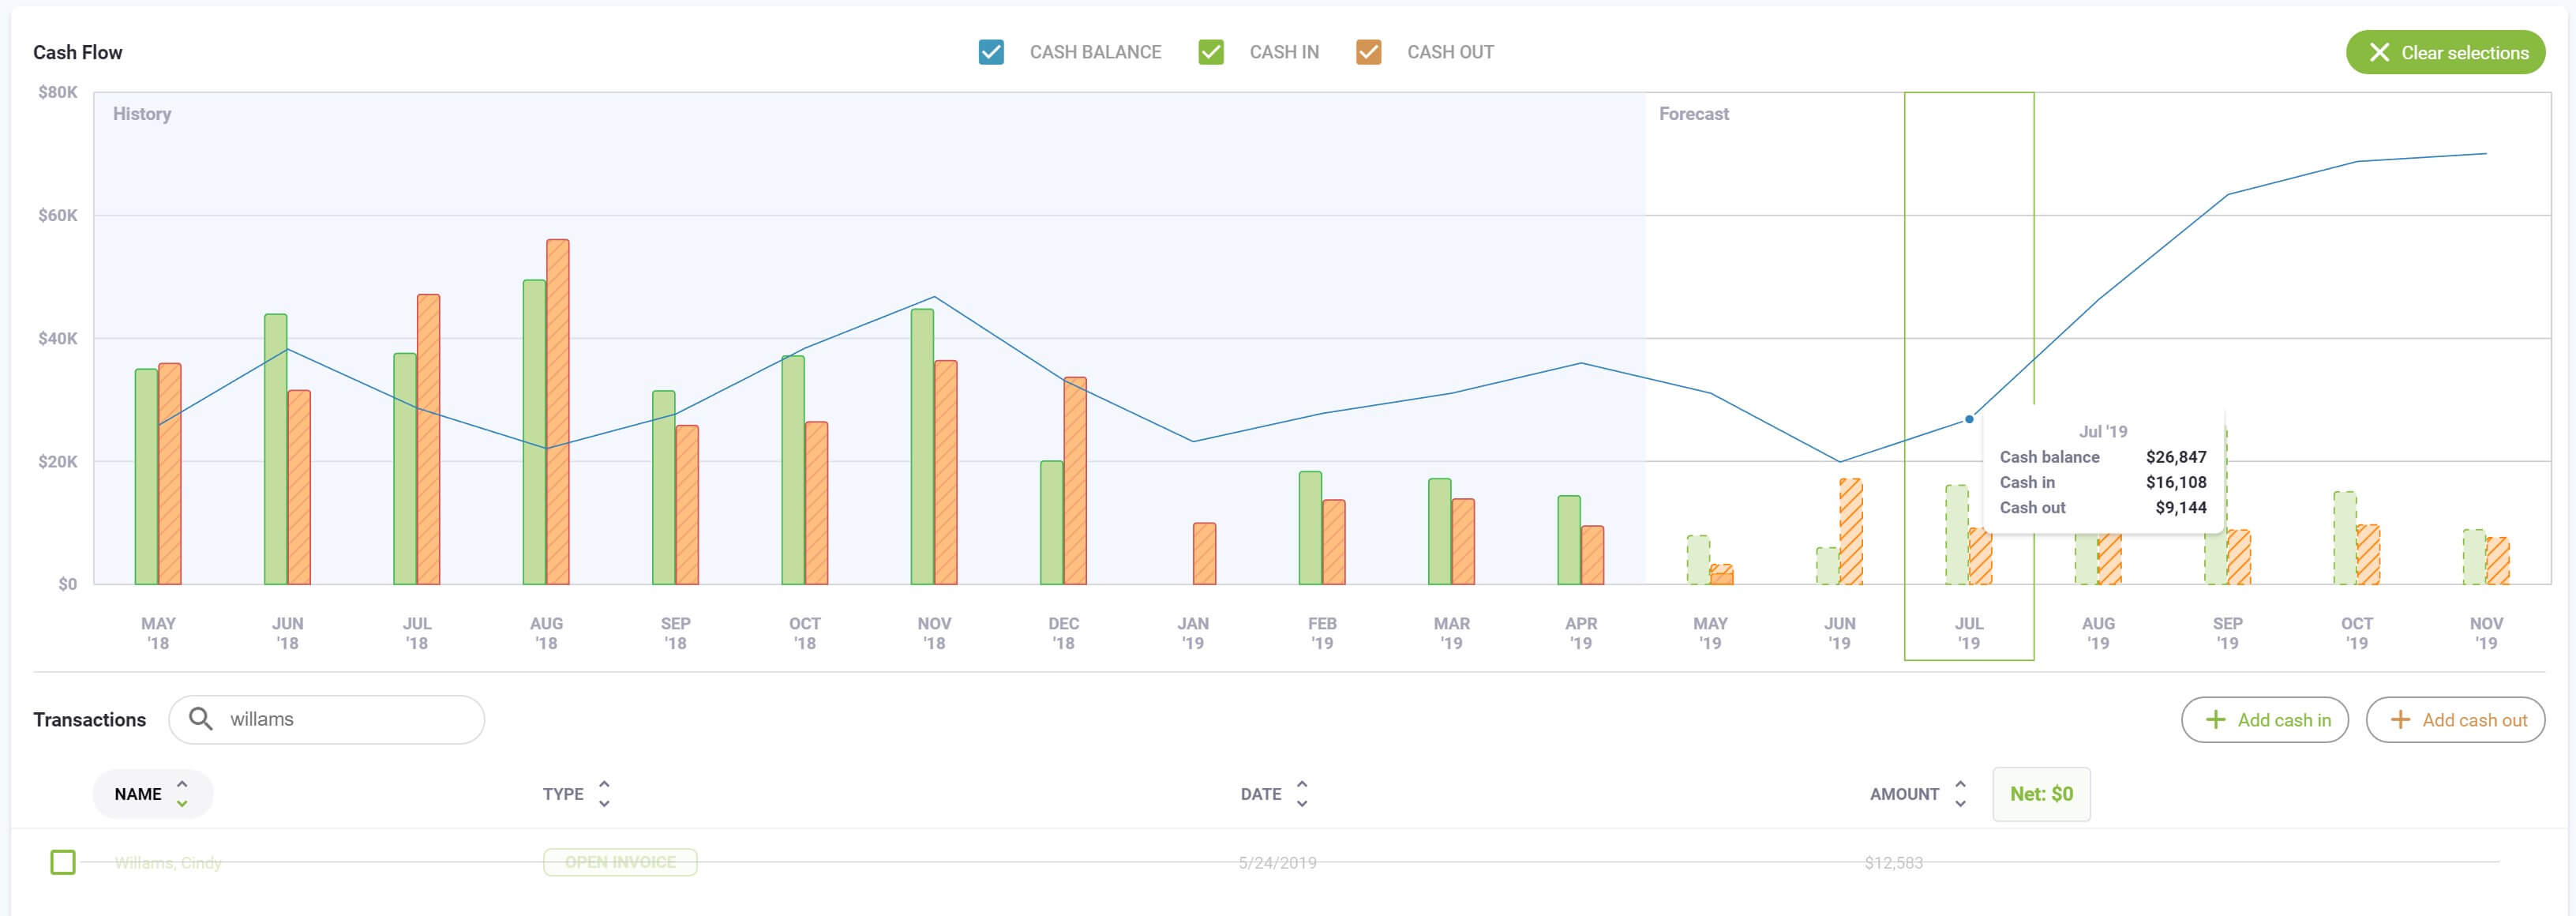
See impact of losing a sale
Uncheck one or more transactions to exclude from the cash flow forecast. Compare the before an after amounts by hovering over future months.
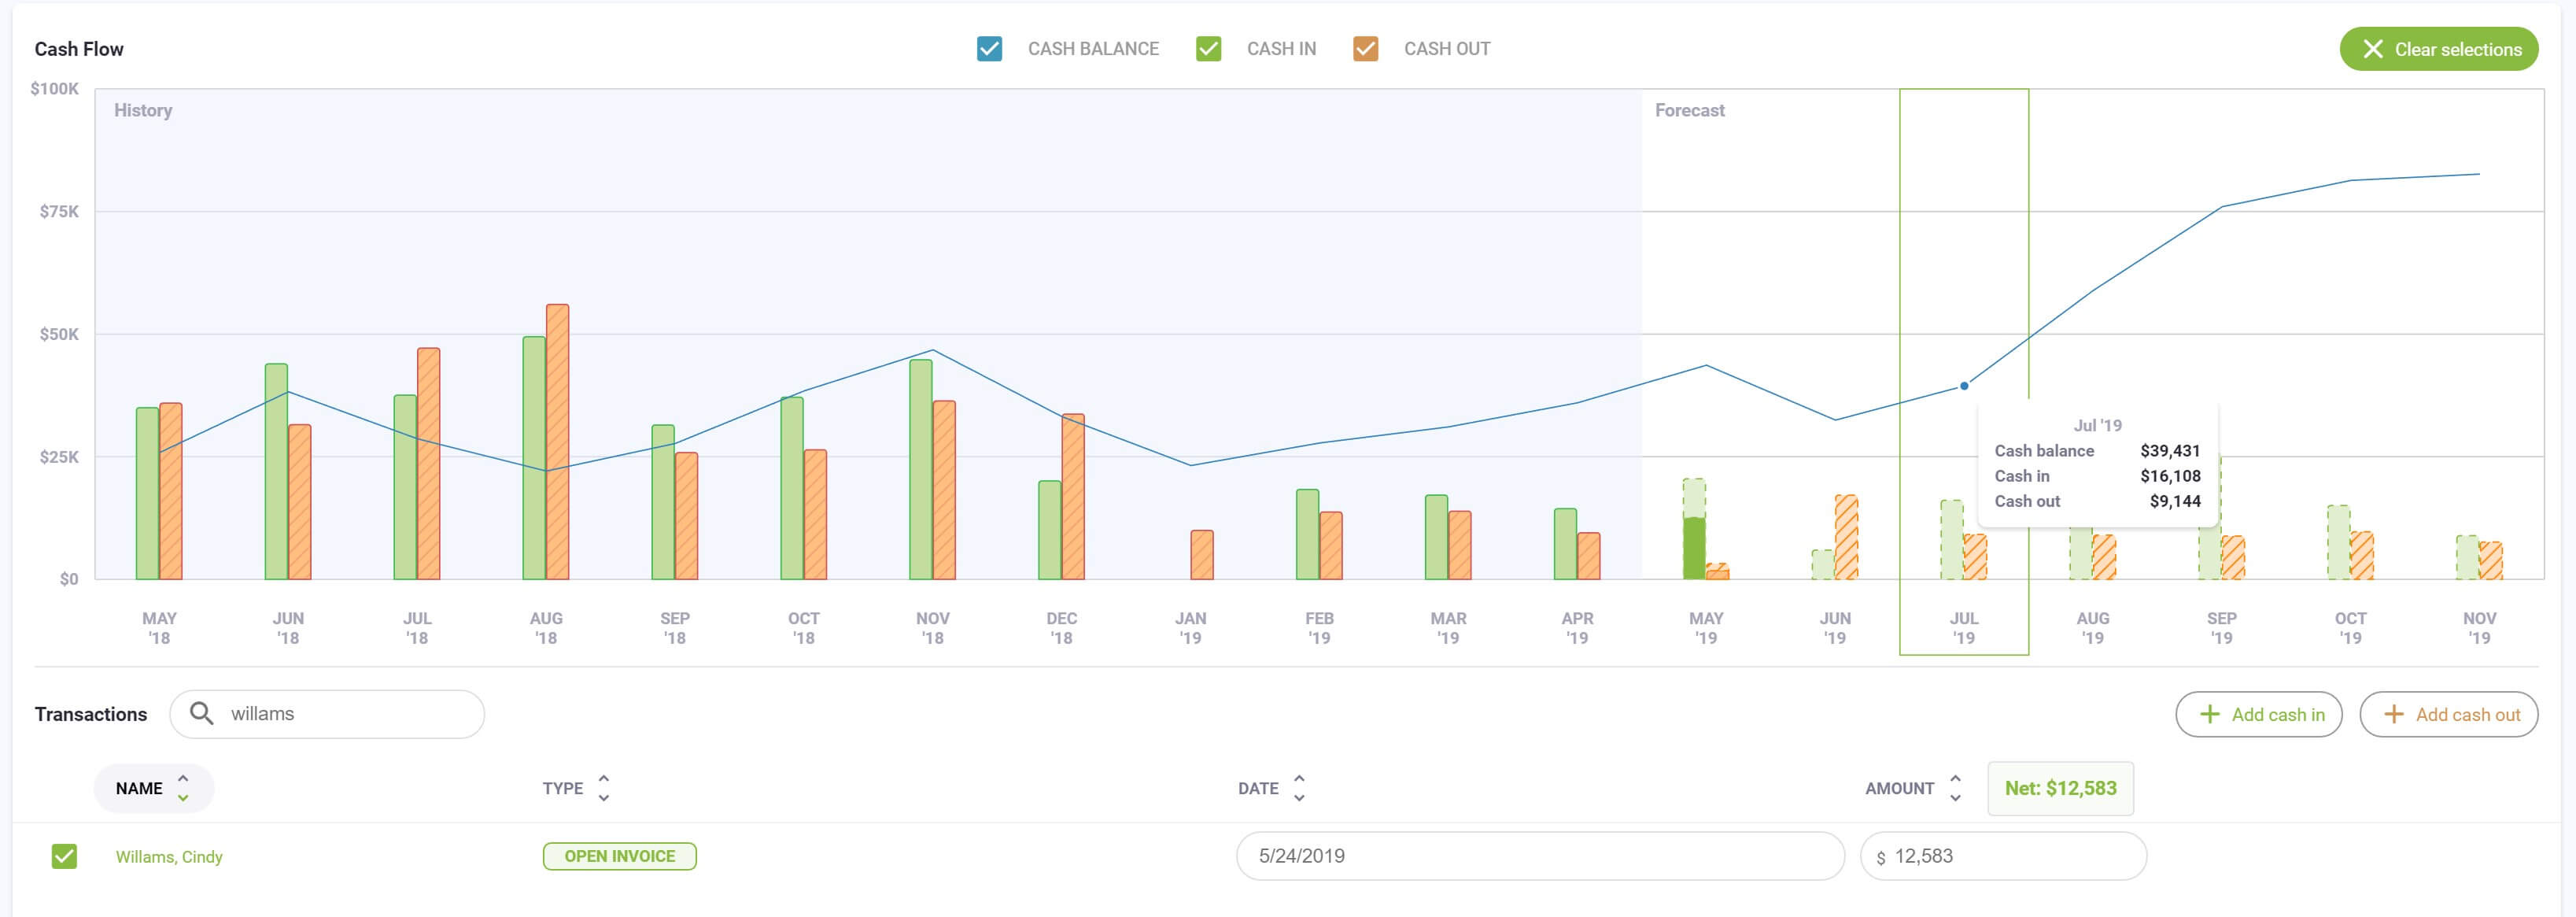
See projected cash balance for any time period
Hover over any chart segment to view forecasted transaction, open invoice and cash-in or cash-out amounts.
We hope you love the new features of the all-new visual interactive chart. As always, let us know if you have any questions.
Author

Michael Patten
Michael is the Lead Product Manager for CashFlowTool where he oversees the product development team, feature set and overall product direction.