This month, we have released 3 super cool new features in CashFlowTool that we hope you find really useful based on your feedback. Enjoy and keep the feedback coming!
Here are 3 new powerful features that you can immediately use in CashFlowTool. Watch the video below to get a quick demo of the new feature and read below to see more.

The introduction of our new Interactive Visual Chart has been well received by many of you. It provided a whole new level of interactivity to view your cash flow by month and get the insights that you need to make informed decisions quickly. We heard from many that you would love for us to add the ability to see the Interactive Visual Chart on a weekly basis! CashFlowTool has now been improved to provide both a monthly and weekly view of your cash flow.
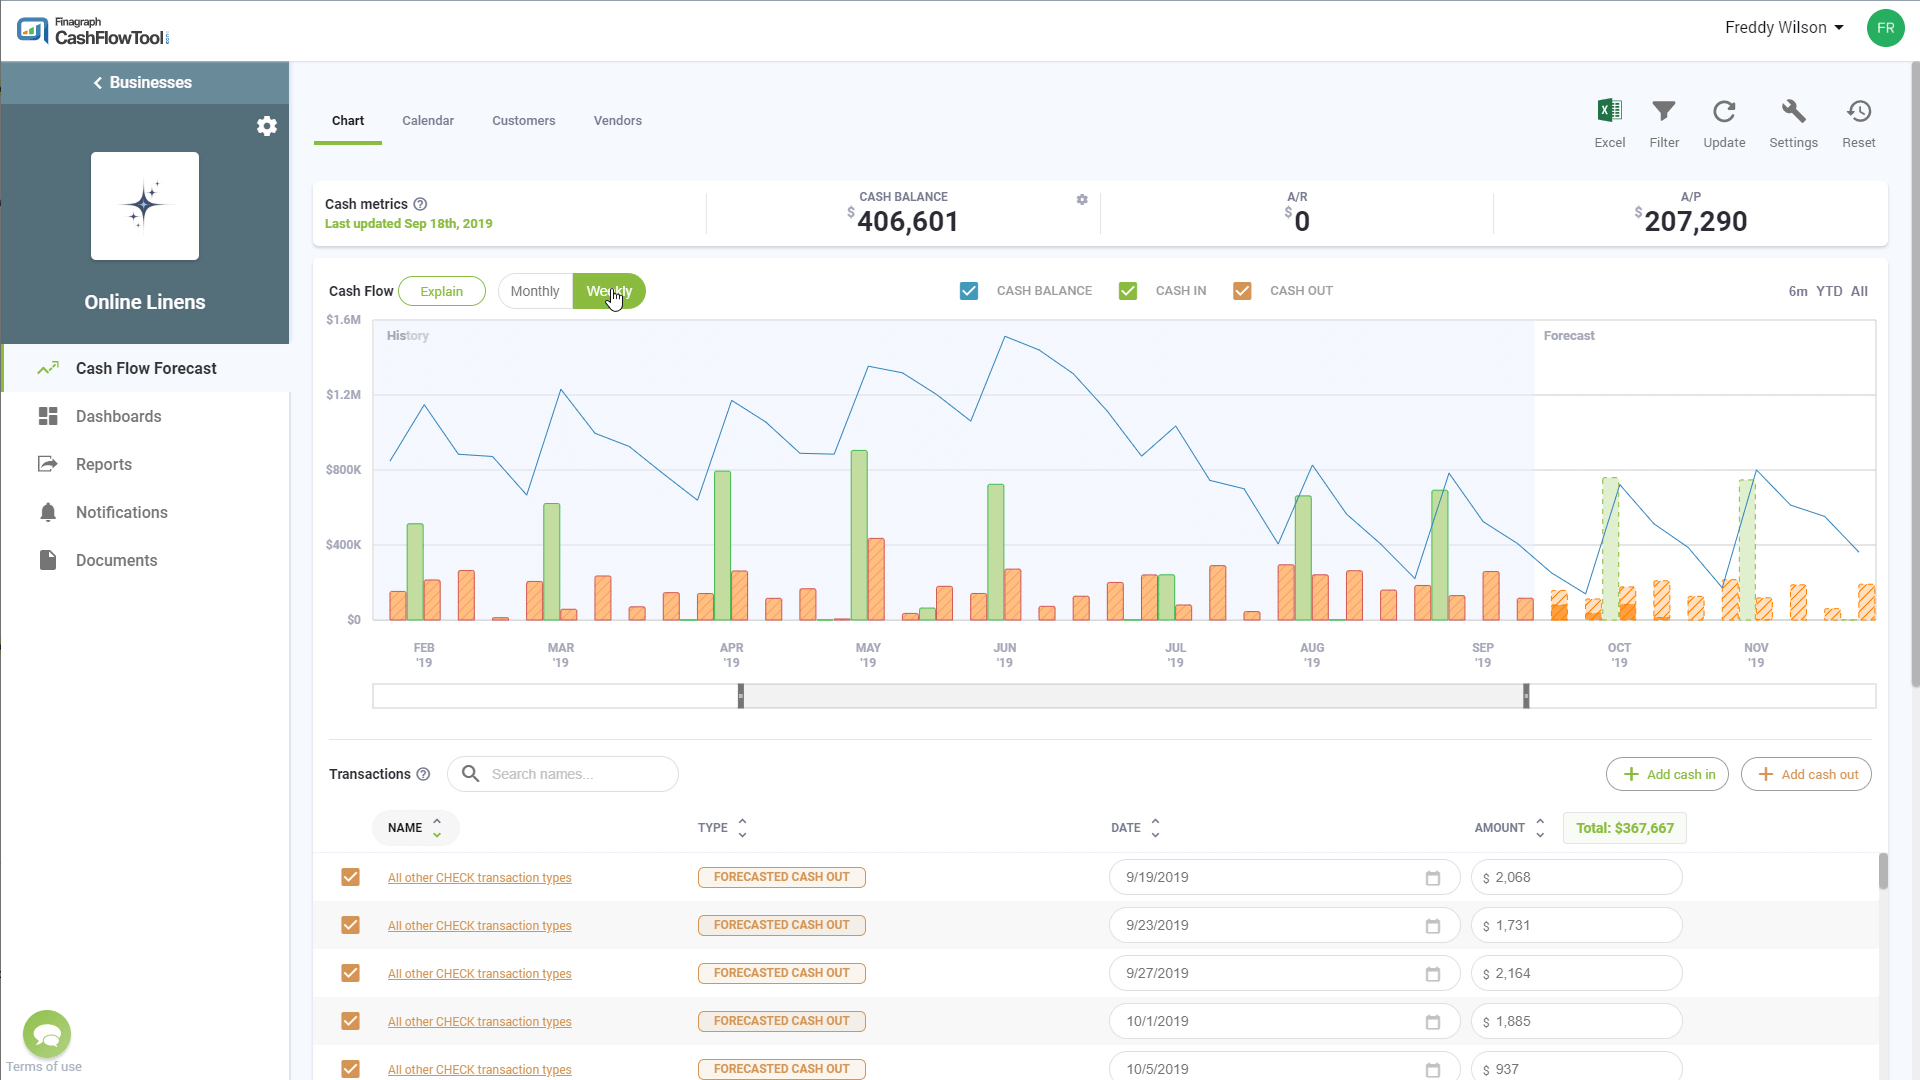 |
Simply click on the Weekly button to activate the weekly view and see the last 52 weeks of historical data, plus the next 24 weeks.. You can use the Interactive Visual Chart in the same way you normally would. You can:
The weekly view also introduced a zoom control where you can rapidly zoom into specific weeks and see all the details. When you select one or more weeks, all the transactions will display below the chart. Now you can quickly see your top customers and vendors week by week. |

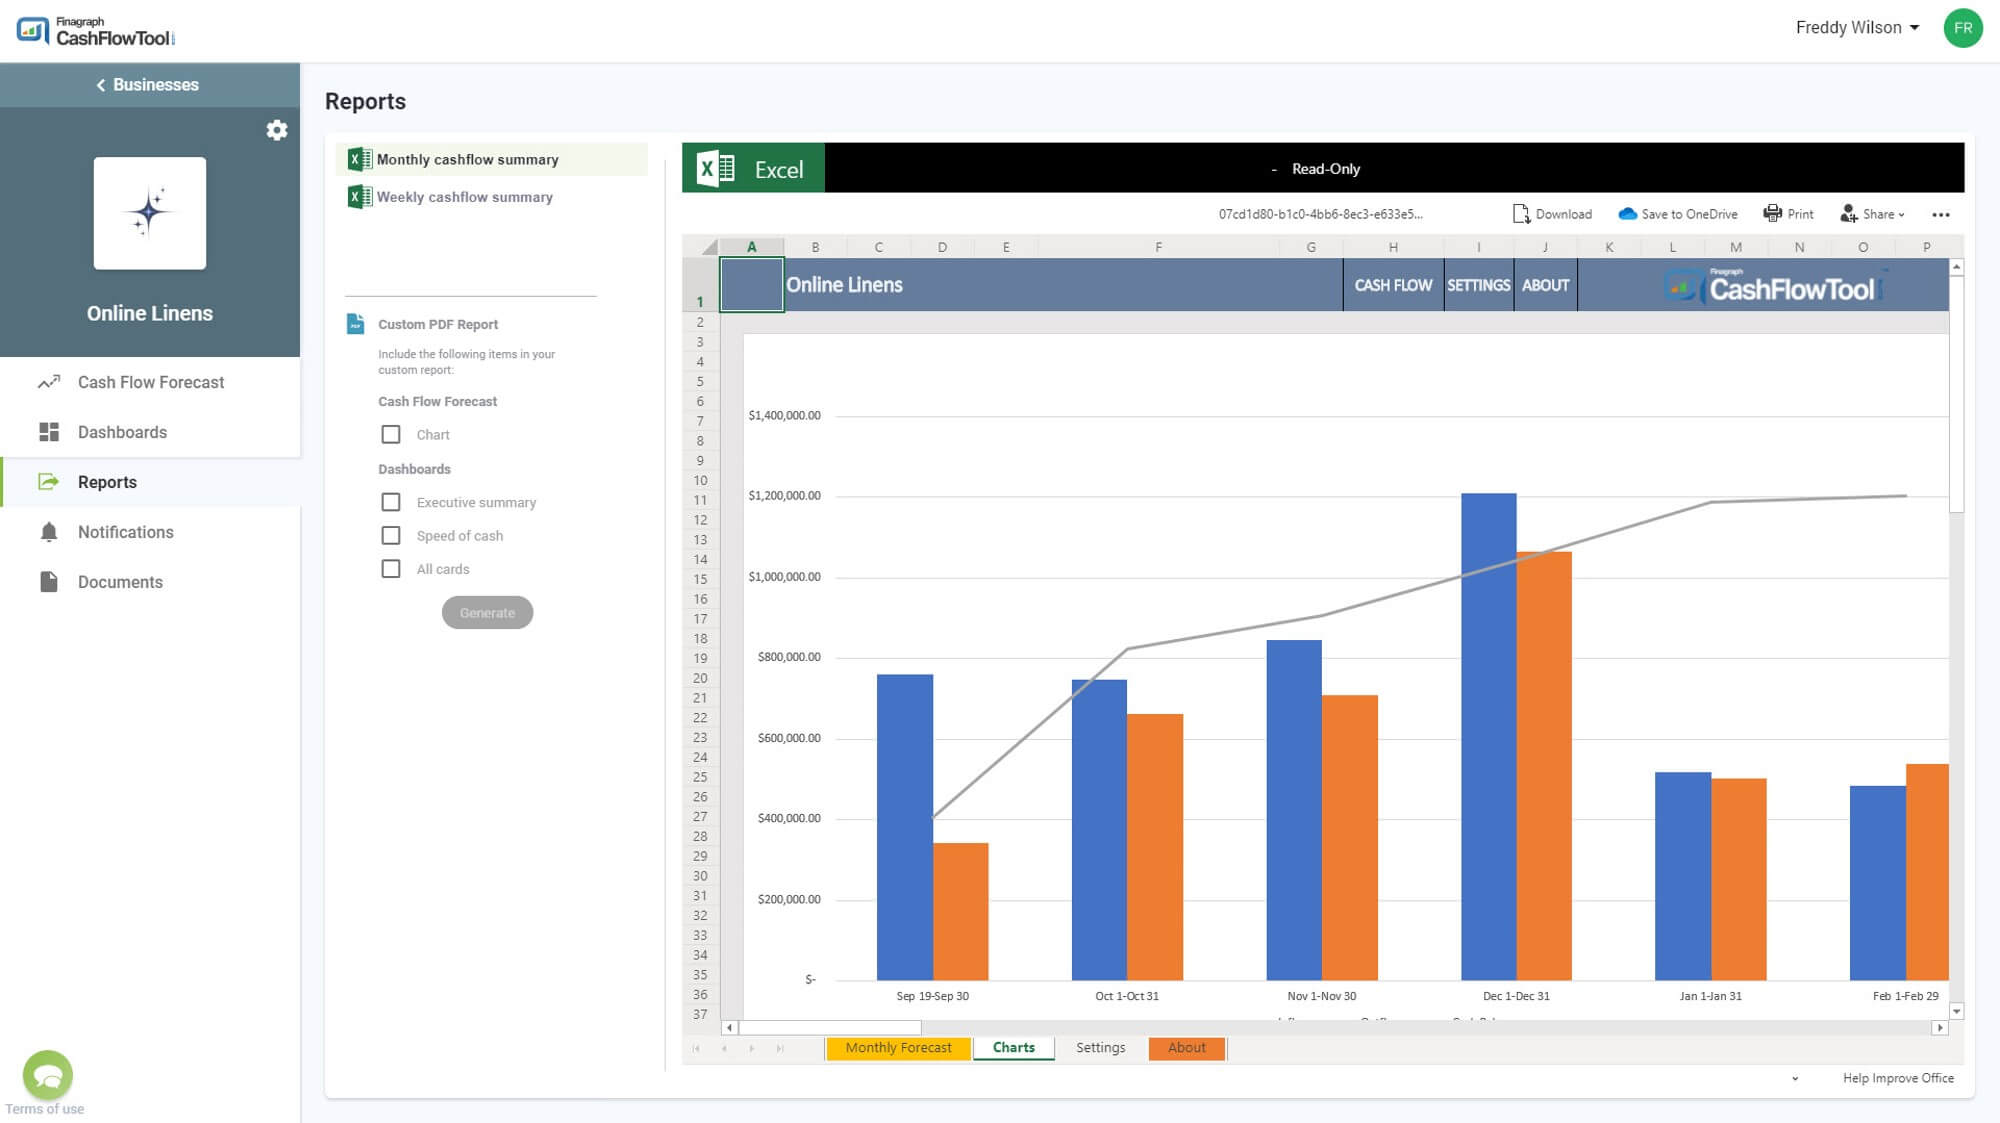
CashFlowTool has always let you export your forecast into a fully formatted Excel template while also including all the formulas so you can do additional forecasting or adjustments if you need. We have enhanced the Excel export functionality considerably to include a live preview, a monthly Excel report as well as a weekly Excel report. All of these have now been consolidated into a single location (the new Report Tab on the left navigation) making it easily to generate the reports you need.
Summary of features:
- Generated weekly and monthly cash flow summary Excel worksheets
- Professionally formatted Excel worksheets include built-in formulas
- Preview the Excel worksheet directly inside CashFlowTool
- Save Excel worksheet to your local drive or Microsoft OneDrive
- Print your Excel CashFlowTool Forecast
.jpg?width=2000&name=Excel%20Export%201%20(1).jpg)
You can also see a live preview of the chart or make settings changes directly here in Excel. When you are ready to print or download, simply click on the buttons at the top of the window.

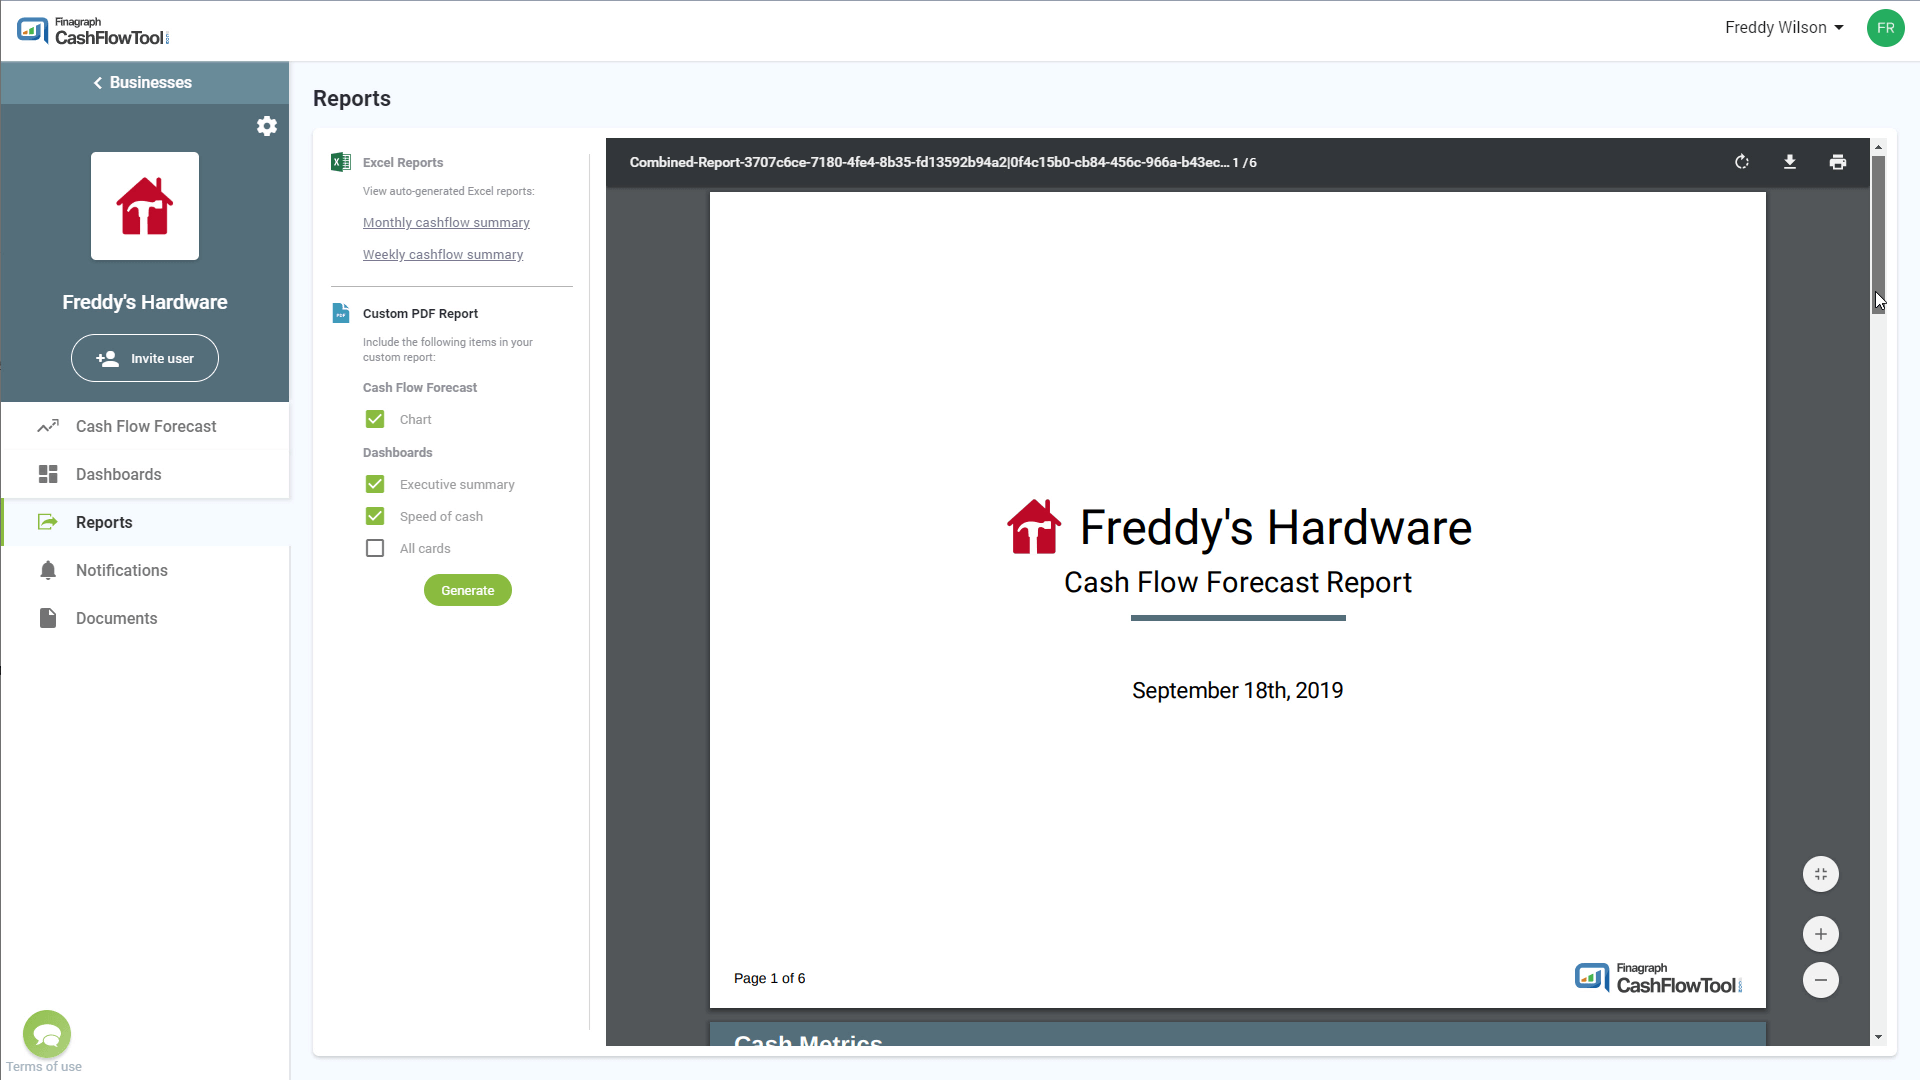
The third new feature is designed to quickly generate an executive-style report of the business.
Business owners: Quickly see at-a-glance your business cash flow forecast and business KPIs to share with co-workers, your accountant or CFO
Accountants: Quickly print a nicely formatted report to give to your clients.
The custom PDF report allows you to choose what to include in your report including the cash flow chart, calendar and any/all of your dashboards. CashFlowTools customer PDF reports look great both when viewed as a PDF and printed and include a title page with your company’s logo.
 |
.gif?width=600&name=ezgif.com-optimize%20(3).gif) |
We hope you enjoy these new enhancements this month as we continue to work hard to improve CashFlowTool. If you have feature requests or suggestions, please email us @ team@cashflowtool.com
Author

Dave Fester
Dave is the Chief Marketing Officer at Finagraph where he is responsible for the company's marketing strategy. He ran a marketing consulting business for 9 years and prior to that, was an executive at Microsoft for 20 years.